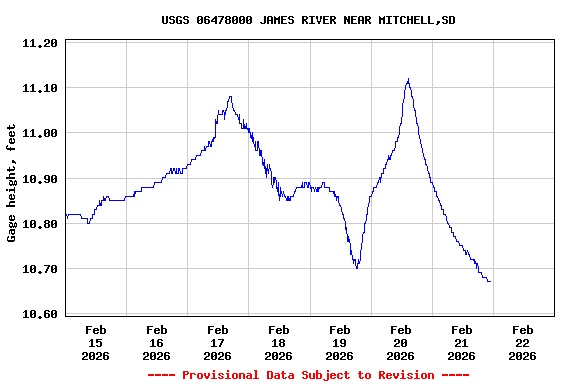
Most recent instantaneous value: Ice 01-25-2026 17:15 CST
See this graph on the Monitoring Location Pages
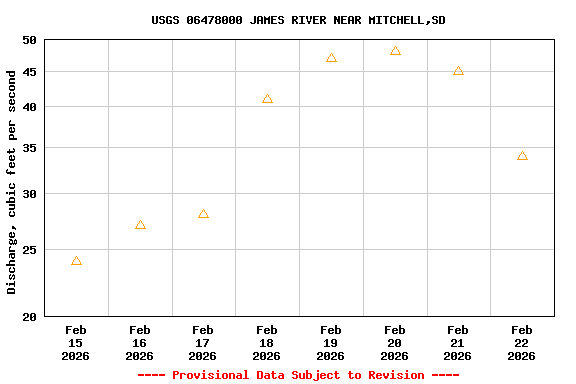
| Most Recent Instantaneous Value Feb 22 | Min (1956) | 25th percen- tile | Median | Mean | 75th percen- tile | Max (2020) |
|---|---|---|---|---|---|---|
| -- unavailable -- | 5.00 | 16 | 34 | 351 | 392 | 2410 |