Most recent instantaneous value: 5.5 02-20-2026 21:00 MST

See this graph on the Monitoring Location Pages
| Station operated in cooperation with the Bureau of
Reclamation. |
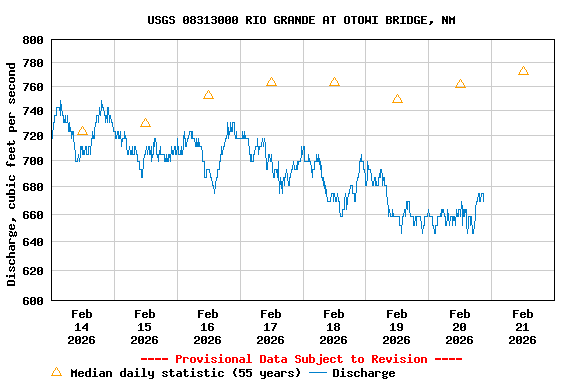
| Min (1978) | 25th percen- tile | Most Recent Instantaneous Value Feb 21 | Median | Mean | 75th percen- tile | Max (1993) |
|---|---|---|---|---|---|---|
| 474 | 659 | 669 | 772 | 902 | 968 | 2690 |


![]() U.S. Department of the Interior |
U.S. Geological Survey
U.S. Department of the Interior |
U.S. Geological Survey
Title: USGS Current Conditions for the Nation
URL:
Page Contact Information: New Mexico Water Data Support Team
Page Last Modified: 2026-02-21 00:06:00 EST
2.97 2.3 vaww01