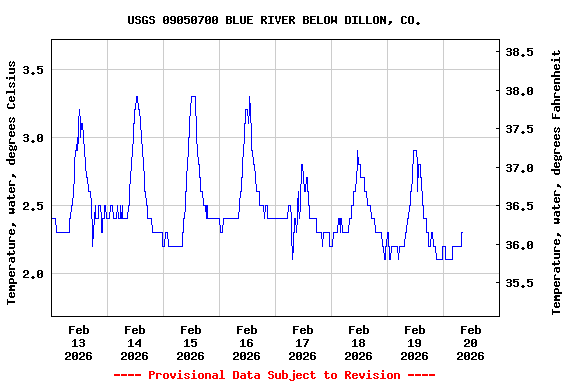
Most recent instantaneous value: 2.2 02-20-2026 07:15 MST
See this graph on the Monitoring Location Pages
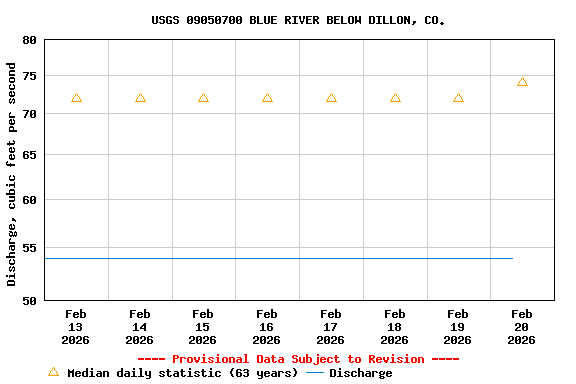
| Min (2005) | Most Recent Instantaneous Value Feb 20 | 25th percen- tile | Median | Mean | 75th percen- tile | Max (1997) |
|---|---|---|---|---|---|---|
| 47.7 | 53.9 | 60 | 74 | 83 | 101 | 209 |
Specific conductance, water, unfiltered, microsiemens per centimeter at 25 degrees Celsius |
||
|
||
![]() U.S. Department of the Interior |
U.S. Geological Survey
U.S. Department of the Interior |
U.S. Geological Survey
Title: USGS Current Conditions for the Nation
URL:
Page Contact Information: Colorado Water Data Support Team
Page Last Modified: 2026-02-20 09:32:13 EST
2.14 1.51 caww01