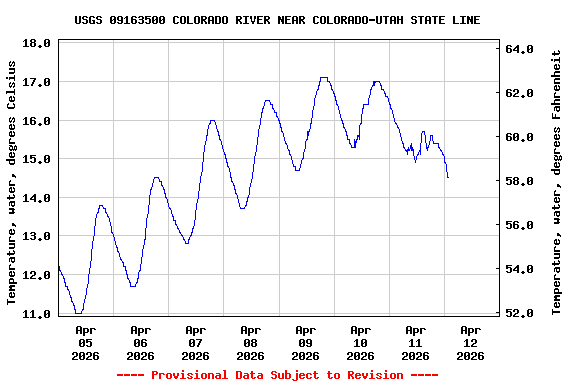
Most recent instantaneous value: 14.8 04-12-2026 00:45 MDT
See this graph on the Monitoring Location Pages
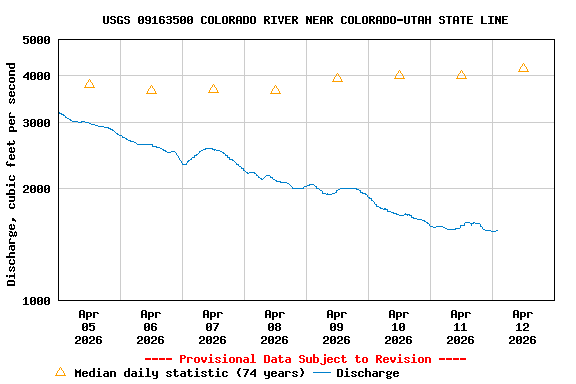
| Min (2003) | Most Recent Instantaneous Value Apr 12 | 25th percen- tile | Median | Mean | 75th percen- tile | Max (1985) |
|---|---|---|---|---|---|---|
| 1380 | 1530 | 3310 | 4170 | 4860 | 5970 | 14100 |
![]() U.S. Department of the Interior |
U.S. Geological Survey
U.S. Department of the Interior |
U.S. Geological Survey
Title: USGS Current Conditions for the Nation
URL:
Page Contact Information: Colorado Water Data Support Team
Page Last Modified: 2026-04-12 02:56:30 EDT
4.35 3.29 sdww02