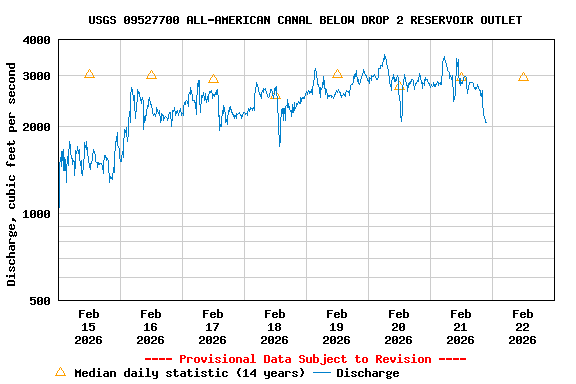
USGS 09527700 ALL-AMERICAN CANAL BELOW DROP 2 RESERVOIR OUTLET

PROVISIONAL DATA SUBJECT TO REVISION

This station managed by the Yuma Field Office; USGS AZ-WSC.

Available Parameters Available Period
  
2023-12-21  2024-04-19
2011-10-26  2024-04-19
2011-10-25  2024-04-19
2023-12-21  2024-04-19
2011-10-25  2024-04-19


 (7)
 

  -- or --


Summary of all available data for this site
Instantaneous-data availability statement


Temperature, water, degrees Fahrenheit

Most recent instantaneous value: 71.1 04-19-2024   18:30 MST
Graph of  Temperature, water, degrees Fahrenheit

Add up to 2 more sites and replot for "Temperature, water, degrees Fahrenheit"

?


Create presentation-quality / stand-alone graph.   Subscribe to WaterAlert      

See this graph on the Monitoring Location Pages


Discharge, cubic feet per second

Most recent instantaneous value: 4720 04-19-2024   18:30 MST
Graph of  Discharge, cubic feet per second

Add up to 2 more sites and replot for "Discharge, cubic feet per second"

?


Create presentation-quality / stand-alone graph.   Subscribe to WaterAlert      

See this graph on the Monitoring Location Pages


Daily discharge, cubic feet per second -- statistics for Apr 19 based on 12 water years of record more
Min
(2020)
25th
percen-
tile
Most Recent
Instantaneous
Value Apr 19
Median Mean 75th
percen-
tile
Max
(2012)
3930 4380 4720 4840 4850 5230 5840


Gage height, feet

Most recent instantaneous value: 43.42 04-19-2024   18:30 MST
Graph of  Gage height, feet

Add up to 2 more sites and replot for "Gage height, feet"

?


Create presentation-quality / stand-alone graph.   Subscribe to WaterAlert      

See this graph on the Monitoring Location Pages


DCP battery voltage, volts

Most recent instantaneous value: 12.8 04-19-2024   18:00 MST
Graph of  DCP battery voltage, volts

Add up to 2 more sites and replot for "DCP battery voltage, volts"

?


Create presentation-quality / stand-alone graph.   Subscribe to WaterAlert      

See this graph on the Monitoring Location Pages


Mean water velocity for discharge computation, feet per second

Most recent instantaneous value: 2.96 04-19-2024   18:30 MST
Graph of  Mean water velocity for discharge computation, feet per second

Add up to 2 more sites and replot for "Mean water velocity for discharge computation, feet per second"

?


Create presentation-quality / stand-alone graph.   Subscribe to WaterAlert      

See this graph on the Monitoring Location Pages