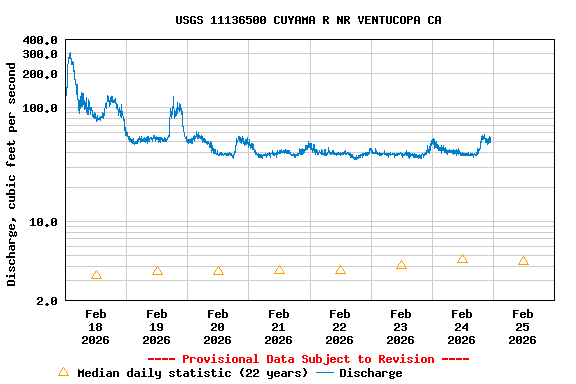
USGS 11136500 CUYAMA R NR VENTUCOPA CA

PROVISIONAL DATA SUBJECT TO REVISION

Click to hidestation-specific text
This station managed by the Santa Maria Field Office.

Available Parameters Available Period
  
2009-10-01  2025-11-02
2009-08-24  2025-11-02
2022-11-03  2025-11-02


 (7)
 

  -- or --


Summary of all available data for this site
Instantaneous-data availability statement


Discharge, cubic feet per second

Most recent instantaneous value: 18.2 11-02-2025   23:50 PST
Graph of  Discharge, cubic feet per second

Add up to 2 more sites and replot for "Discharge, cubic feet per second"

?


Create presentation-quality / stand-alone graph.   Subscribe to WaterAlert      

See this graph on the Monitoring Location Pages


Daily discharge, cubic feet per second -- statistics for Nov 3 based on 22 water years of record more
Min
(2014)
25th
percen-
tile
Median Mean 75th
percen-
tile
Max
(2025)
Most Recent
Instantaneous
Value Nov 3
0.10 0.6 0.92 1.2 1.7 3.17 18.2


Gage height, feet

Most recent instantaneous value: 2.89 11-02-2025   23:50 PST
Graph of  Gage height, feet

Add up to 2 more sites and replot for "Gage height, feet"

?


Create presentation-quality / stand-alone graph.   Subscribe to WaterAlert      

See this graph on the Monitoring Location Pages


Stream water level elevation above NAVD 1988, in feet

Most recent instantaneous value: 3531.81 11-02-2025   23:50 PST
Graph of  Stream water level elevation above NAVD 1988, in feet

Add up to 2 more sites and replot for "Stream water level elevation above NAVD 1988, in feet"

?


Create presentation-quality / stand-alone graph.   Subscribe to WaterAlert      

See this graph on the Monitoring Location Pages