USGS 11206820 MARBLE FORK KAWEAH R AB HORSE C NR LODGEPOLE CA

PROVISIONAL DATA SUBJECT TO REVISION

Click to hidestation-specific text
> Rating Information
This station managed by the Santa Maria Field Office.

Available Parameters Available Period
  
2013-10-01  2025-09-01
2013-10-01  2025-09-01
2013-10-01  2025-09-01
2022-11-16  2025-09-01


 (7)
 

  -- or --


Summary of all available data for this site
Instantaneous-data availability statement
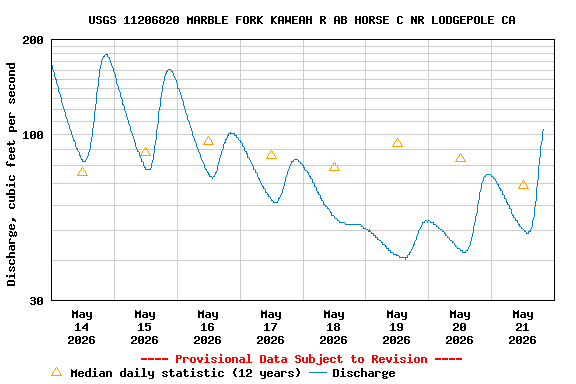

Temperature, water, degrees Celsius

Most recent instantaneous value: 10.4 09-01-2025   03:45 PDT
Graph of  Temperature, water, degrees Celsius

Add up to 2 more sites and replot for "Temperature, water, degrees Celsius"

?


Create presentation-quality / stand-alone graph.   Subscribe to WaterAlert      

See this graph on the Monitoring Location Pages


Discharge, cubic feet per second

Most recent instantaneous value: 0.33 09-01-2025   03:45 PDT
Graph of  Discharge, cubic feet per second

Add up to 2 more sites and replot for "Discharge, cubic feet per second"

?


Create presentation-quality / stand-alone graph.   Subscribe to WaterAlert      

See this graph on the Monitoring Location Pages


Daily discharge, cubic feet per second -- statistics for Sep 1 based on 11 water years of record more
Min
(2014)
25th
percen-
tile
Median Most Recent
Instantaneous
Value Sep 1
Mean 75th
percen-
tile
Max
(2023)
0.08 0.17 0.31 0.33 1.9 3.1 12.0


Gage height, feet

Most recent instantaneous value: 6.79 09-01-2025   03:45 PDT
Graph of  Gage height, feet

Add up to 2 more sites and replot for "Gage height, feet"

?


Create presentation-quality / stand-alone graph.   Subscribe to WaterAlert      

See this graph on the Monitoring Location Pages


Stream water level elevation above NAVD 1988, in feet

Most recent instantaneous value: 7141.89 09-01-2025   03:45 PDT
Graph of  Stream water level elevation above NAVD 1988, in feet

Add up to 2 more sites and replot for "Stream water level elevation above NAVD 1988, in feet"

?


Create presentation-quality / stand-alone graph.   Subscribe to WaterAlert      

See this graph on the Monitoring Location Pages