USGS 11390500 SACRAMENTO R BL WILKINS SLOUGH NR GRIMES CA

PROVISIONAL DATA SUBJECT TO REVISION

Click to hidestation-specific text
> Rating Information
This station managed by the Sacramento Field Office.

Available Parameters Available Period
  
2007-10-03  2026-01-08
1987-10-01  2026-01-08
2007-10-01  2026-01-08
2023-07-10  2026-01-08


 (7)
 

  -- or --


Summary of all available data for this site
Instantaneous-data availability statement
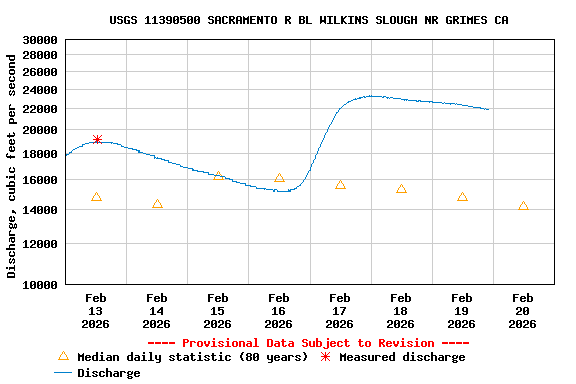

Temperature, water, degrees Celsius

Most recent instantaneous value: 11.0 01-08-2026   21:15 PST
Graph of  Temperature, water, degrees Celsius

Add up to 2 more sites and replot for "Temperature, water, degrees Celsius"

?


Create presentation-quality / stand-alone graph.   Subscribe to WaterAlert      

See this graph on the Monitoring Location Pages


Discharge, cubic feet per second

Most recent instantaneous value: 26100 01-08-2026   21:15 PST
Graph of  Discharge, cubic feet per second

Add up to 2 more sites and replot for "Discharge, cubic feet per second"

?


Create presentation-quality / stand-alone graph.   Subscribe to WaterAlert      

See this graph on the Monitoring Location Pages


Daily discharge, cubic feet per second -- statistics for Jan 9 based on 79 water years of record more
Min
(2014)
25th
percen-
tile
Median Mean 75th
percen-
tile
Most Recent
Instantaneous
Value Jan 9
Max
(2006)
3880 7160 11600 13600 20300 26100 29300


Gage height, feet

Most recent instantaneous value: 48.11 01-08-2026   21:15 PST
Graph of  Gage height, feet

Add up to 2 more sites and replot for "Gage height, feet"

?


Create presentation-quality / stand-alone graph.   Subscribe to WaterAlert      

See this graph on the Monitoring Location Pages


Stream water level elevation above NAVD 1988, in feet

Most recent instantaneous value: 46.83 01-08-2026   21:15 PST
Graph of  Stream water level elevation above NAVD 1988, in feet

Add up to 2 more sites and replot for "Stream water level elevation above NAVD 1988, in feet"

?


Create presentation-quality / stand-alone graph.   Subscribe to WaterAlert      

See this graph on the Monitoring Location Pages