USGS 11481000 MAD R NR ARCATA CA

PROVISIONAL DATA SUBJECT TO REVISION

Click to hidestation-specific text
> Rating Information
This station managed by the Redding Field Office.

Available Parameters Available Period
  
1995-10-01  2025-11-19
2007-10-01  2025-11-19
2022-11-19  2025-11-19


 (7)
 

  -- or --


Summary of all available data for this site
Instantaneous-data availability statement
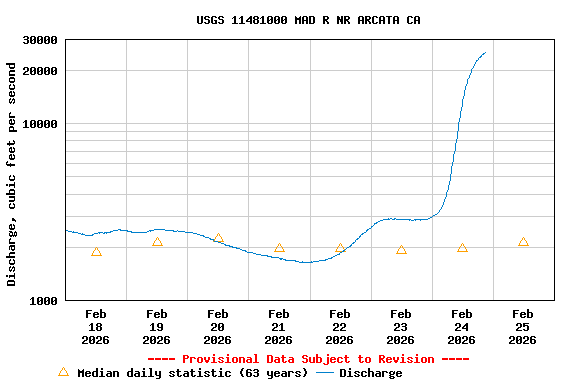

Discharge, cubic feet per second

Most recent instantaneous value: 725 11-19-2025   22:45 PST
Graph of  Discharge, cubic feet per second

Add up to 2 more sites and replot for "Discharge, cubic feet per second"

?


Create presentation-quality / stand-alone graph.   Subscribe to WaterAlert      

See this graph on the Monitoring Location Pages


Daily discharge, cubic feet per second -- statistics for Nov 20 based on 63 water years of record more
Min
(1977)
25th
percen-
tile
Median Most Recent
Instantaneous
Value Nov 20
75th
percen-
tile
Mean Max
(1984)
23.0 102 371 725 1060 1070 8980


Gage height, feet

Most recent instantaneous value: 7.45 11-19-2025   22:45 PST
Graph of  Gage height, feet

Add up to 2 more sites and replot for "Gage height, feet"

?


Create presentation-quality / stand-alone graph.   Subscribe to WaterAlert      

See this graph on the Monitoring Location Pages


Stream water level elevation above NAVD 1988, in feet

Most recent instantaneous value: 21.70 11-19-2025   22:45 PST
Graph of  Stream water level elevation above NAVD 1988, in feet

Add up to 2 more sites and replot for "Stream water level elevation above NAVD 1988, in feet"

?


Create presentation-quality / stand-alone graph.   Subscribe to WaterAlert      

See this graph on the Monitoring Location Pages