USGS 11525500 TRINITY R A LEWISTON CA

PROVISIONAL DATA SUBJECT TO REVISION

Click to hidestation-specific text
> Rating Information
This station managed by the Redding Field Office.

Available Parameters Available Period
  
2020-02-03  2026-02-23
1988-10-01  2026-02-23
2007-10-01  2026-02-23
2023-02-23  2026-02-23


 (7)
 

  -- or --


Summary of all available data for this site
Instantaneous-data availability statement
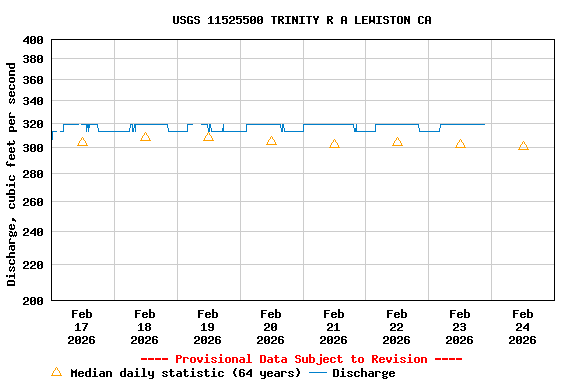

Temperature, water, degrees Celsius

Most recent instantaneous value: 7.7 02-23-2026   21:15 PST
Graph of  Temperature, water, degrees Celsius

Add up to 2 more sites and replot for "Temperature, water, degrees Celsius"

?


Create presentation-quality / stand-alone graph.   Subscribe to WaterAlert      

See this graph on the Monitoring Location Pages


Discharge, cubic feet per second

Most recent instantaneous value: 319 02-23-2026   21:15 PST
Graph of  Discharge, cubic feet per second

Add up to 2 more sites and replot for "Discharge, cubic feet per second"

?


Create presentation-quality / stand-alone graph.   Subscribe to WaterAlert      

See this graph on the Monitoring Location Pages


Daily discharge, cubic feet per second -- statistics for Feb 24 based on 64 water years of record more
Min
(1977)
25th
percen-
tile
Median Most Recent
Instantaneous
Value Feb 24
75th
percen-
tile
Mean Max
(1996)
145 285 301 319 333 700 6160


Gage height, feet

Most recent instantaneous value: 13.80 02-23-2026   21:15 PST
Graph of  Gage height, feet

Add up to 2 more sites and replot for "Gage height, feet"

?


Create presentation-quality / stand-alone graph.   Subscribe to WaterAlert      

See this graph on the Monitoring Location Pages


Stream water level elevation above NAVD 1988, in feet

Most recent instantaneous value: 1835.25 02-23-2026   21:15 PST
Graph of  Stream water level elevation above NAVD 1988, in feet

Add up to 2 more sites and replot for "Stream water level elevation above NAVD 1988, in feet"

?


Create presentation-quality / stand-alone graph.   Subscribe to WaterAlert      

See this graph on the Monitoring Location Pages