USGS 14144700 COLUMBIA RIVER AT VANCOUVER, WA

PROVISIONAL DATA SUBJECT TO REVISION

Click to hidestation-specific text

Station operated in cooperation with the U.S. Army Corps of Engineers and the National Weather Service.

NOTE: River forecasts and additional data can be obtained at the 
National Weather Service's Advanced Hydrologic Prediction Services web page.

Boating safety tips
Available Parameters Available Period
  
2016-03-03  2026-02-26
2007-10-01  2026-02-26
2016-04-16  2026-02-26
2016-03-04  2026-02-25
2016-03-03  2026-02-26
2016-03-03  2026-02-26
2016-03-03  2026-02-26
2016-03-03  2026-02-26
2016-03-03  2026-02-26
2016-03-03  2026-02-26


 (7)
 

  -- or --


Summary of all available data for this site
Instantaneous-data availability statement


Discharge, cubic feet per second, Upstream

Most recent instantaneous value: 227000 02-26-2026   21:00 PST
Graph of  Discharge, cubic feet per second

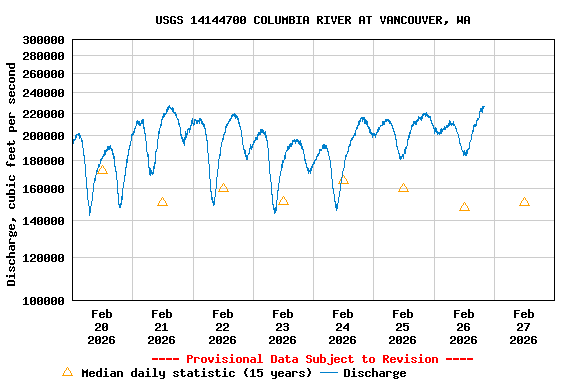
Add up to 2 more sites and replot for "Discharge, cubic feet per second, Upstream"

?


Create presentation-quality / stand-alone graph.   Subscribe to WaterAlert      

See this graph on the Monitoring Location Pages


Daily discharge, cubic feet per second -- statistics for Feb 27 based on 15 water years of record more
Min
(1964)
25th
percen-
tile
Median Mean 75th
percen-
tile
Most Recent
Instantaneous
Value Feb 27
Max
(2017)
117000 140000 151000 167000 210000 227000 269000


Gage height, feet, Downstream, [NWS GAGE ON I-5 BRIDGE]

Most recent instantaneous value: 6.88 02-26-2026   21:45 PST
Graph of  Gage height, feet, [NWS GAGE ON I-5 BRIDGE]

Add up to 2 more sites and replot for "Gage height, feet, Downstream, [NWS GAGE ON I-5 BRIDGE]"

?


Create presentation-quality / stand-alone graph.   Subscribe to WaterAlert      

See this graph on the Monitoring Location Pages


Turbidity, water, unfiltered, monochrome near infra-red LED light, 780-900 nm, detection angle 90 +-2.5 degrees, formazin nephelometric units (FNU), Upstream, [USCG DOLPHIN]

Most recent instantaneous value: 3.9 02-26-2026   21:05 PST
Graph of  Turbidity, water, unfiltered, monochrome near infra-red LED light, 780-900 nm, detection angle 90 +-2.5 degrees, formazin nephelometric units (FNU), [USCG DOLPHIN]

Add up to 2 more sites and replot for "Turbidity, water, unfiltered, monochrome near infra-red LED light, 780-900 nm, detection angle 90 +-2.5 degrees, formazin nephelometric units (FNU), Upstream, [USCG DOLPHIN]"

?


Create presentation-quality / stand-alone graph.   Subscribe to WaterAlert      

See this graph on the Monitoring Location Pages


Discharge, tidally filtered, cubic feet per second

Most recent instantaneous value: 203000 02-25-2026   10:00 PST
Graph of  Discharge, tidally filtered, cubic feet per second

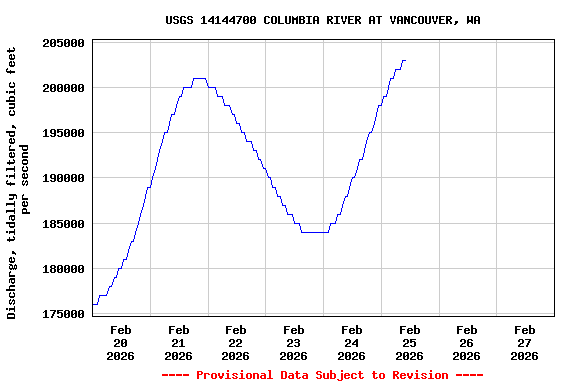
Add up to 2 more sites and replot for "Discharge, tidally filtered, cubic feet per second"

?


Create presentation-quality / stand-alone graph.   Subscribe to WaterAlert      

See this graph on the Monitoring Location Pages


Sediment corrected acoustic backscatter (SCB), decibels, Upstream

Most recent instantaneous value: 87.7 02-26-2026   21:00 PST
Graph of  Sediment corrected acoustic backscatter (SCB), decibels

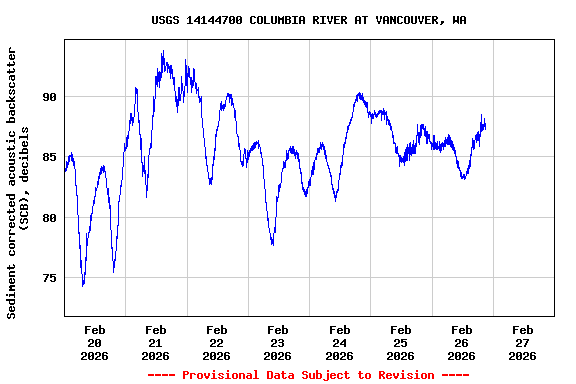
Add up to 2 more sites and replot for "Sediment corrected acoustic backscatter (SCB), decibels, Upstream"

?


Create presentation-quality / stand-alone graph.   Subscribe to WaterAlert      

See this graph on the Monitoring Location Pages


Mean water velocity for discharge computation, feet per second, Upstream, [USCG DOLPHIN]

Most recent instantaneous value: 2.49 02-26-2026   21:00 PST
Graph of  Mean water velocity for discharge computation, feet per second, [USCG DOLPHIN]

Add up to 2 more sites and replot for "Mean water velocity for discharge computation, feet per second, Upstream, [USCG DOLPHIN]"

?


Create presentation-quality / stand-alone graph.   Subscribe to WaterAlert      

See this graph on the Monitoring Location Pages


Suspended sediment load, water, unfiltered, computed, the product of regression-computed suspended sediment concentration and streamflow, short tons per day, Upstream

Most recent instantaneous value: 6210 02-26-2026   21:00 PST
Graph of  Suspended sediment load, water, unfiltered, computed, the product of regression-computed suspended sediment concentration and streamflow, short tons per day

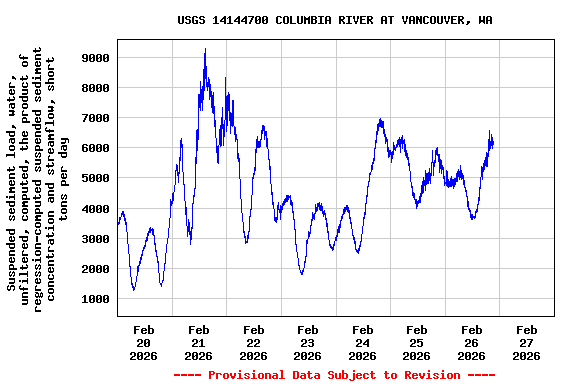
Add up to 2 more sites and replot for "Suspended sediment load, water, unfiltered, computed, the product of regression-computed suspended sediment concentration and streamflow, short tons per day, Upstream"

?


Create presentation-quality / stand-alone graph.   Subscribe to WaterAlert      

See this graph on the Monitoring Location Pages


Upper 90 percent prediction limit for SSC by regression (PCODE 99409), milligrams per liter, Upstream, [Total Suspended Sediment]

Most recent instantaneous value: 16.6 02-26-2026   21:00 PST
Graph of  Upper 90 percent prediction limit for SSC by regression (PCODE 99409), milligrams per liter, [Total Suspended Sediment]

Add up to 2 more sites and replot for "Upper 90 percent prediction limit for SSC by regression (PCODE 99409), milligrams per liter, Upstream, [Total Suspended Sediment]"

?


Create presentation-quality / stand-alone graph.   Subscribe to WaterAlert      

See this graph on the Monitoring Location Pages


Lower 90 percent prediction limit for SSC by regression (PCODE 99409), milligrams per liter, Upstream, [Total Suspended Sediment]

Most recent instantaneous value: 6.2 02-26-2026   21:00 PST
Graph of  Lower 90 percent prediction limit for SSC by regression (PCODE 99409), milligrams per liter, [Total Suspended Sediment]

Add up to 2 more sites and replot for "Lower 90 percent prediction limit for SSC by regression (PCODE 99409), milligrams per liter, Upstream, [Total Suspended Sediment]"

?


Create presentation-quality / stand-alone graph.   Subscribe to WaterAlert      

See this graph on the Monitoring Location Pages


Suspended sediment concentration, water, unfiltered, estimated by regression equation, milligrams per liter, Upstream, [Total Suspended Sediment]

Most recent instantaneous value: 10.1 02-26-2026   21:00 PST
Graph of  Suspended sediment concentration, water, unfiltered, estimated by regression equation, milligrams per liter, [Total Suspended Sediment]

Add up to 2 more sites and replot for "Suspended sediment concentration, water, unfiltered, estimated by regression equation, milligrams per liter, Upstream, [Total Suspended Sediment]"

?


Create presentation-quality / stand-alone graph.   Subscribe to WaterAlert      

See this graph on the Monitoring Location Pages