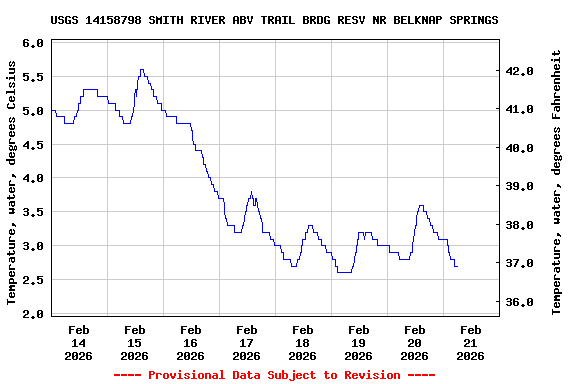
Most recent instantaneous value: 2.7 02-21-2026 06:00 PST
See this graph on the Monitoring Location Pages
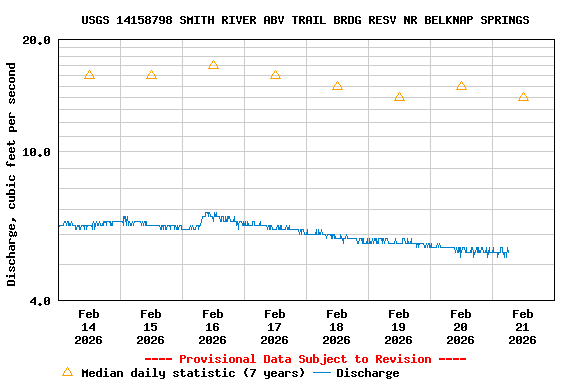
| Most Recent Instantaneous Value Feb 21 | Min (2023) | 25th percen- tile | Median | Mean | 75th percen- tile | Max (2021) |
|---|---|---|---|---|---|---|
| 5.38 | 9.91 | 10 | 14 | 16 | 22 | 28.4 |
![]() U.S. Department of the Interior |
U.S. Geological Survey
U.S. Department of the Interior |
U.S. Geological Survey
Title: USGS Current Conditions for the Nation
URL:
Page Contact Information: Oregon Water Data Support Team
Page Last Modified: 2026-02-21 12:34:48 EST
5.3 4.5 sdww02