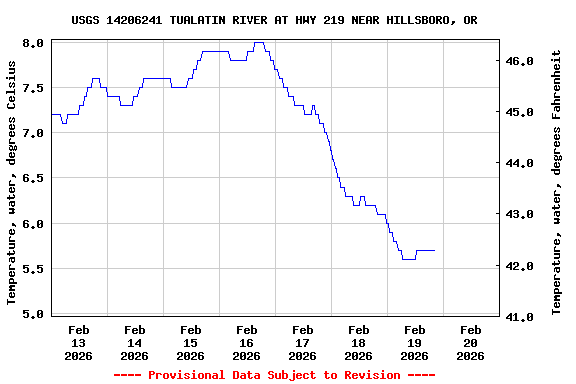
Most recent instantaneous value: 5.7 02-19-2026 20:00 PST
See this graph on the Monitoring Location Pages
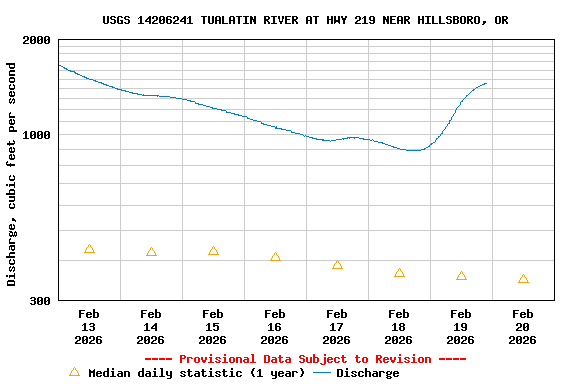
| Mean | Min (2022) | Median | Max (2022) | Most Recent Instantaneous Value Feb 20 |
|---|---|---|---|---|
| 349 | 349 | 349 | 349 | 1450 |
Chlorophyll fluorescence (fChl), water, in situ, concentration estimated from reference material, micrograms per liter as chlorophyll |
||
|
||
Phycocyanin fluorescence (fPC), water, in situ, concentration estimated from reference material, micrograms per liter as phycocyanin |
||
|
||
![]() U.S. Department of the Interior |
U.S. Geological Survey
U.S. Department of the Interior |
U.S. Geological Survey
Title: USGS Current Conditions for the Nation
URL:
Page Contact Information: Oregon Water Data Support Team
Page Last Modified: 2026-02-20 01:00:21 EST
8.21 6.99 sdww02