USGS 14240525 NF TOUTLE RIVER BELOW SRS NEAR KID VALLEY, WA

PROVISIONAL DATA SUBJECT TO REVISION

Click to hidestation-specific text
Arrow

Funding for this site is provided by the cooperators / programs below:
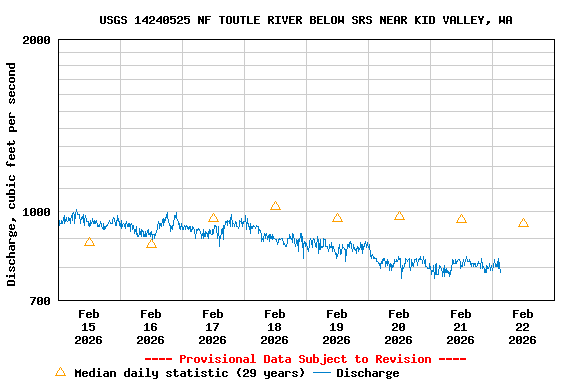

Boating safety tips

This station managed by the Western Washington Field Office (Tacoma).

Available Parameters Available Period
  
2001-02-02  2025-10-24
2007-10-01  2025-10-24
2023-08-22  2025-10-24


 (7)
 

  -- or --


Summary of all available data for this site
Instantaneous-data availability statement


Discharge, cubic feet per second

Most recent instantaneous value: 1010 10-24-2025   22:00 PDT
Graph of  Discharge, cubic feet per second

Add up to 2 more sites and replot for "Discharge, cubic feet per second"

?


Create presentation-quality / stand-alone graph.   Subscribe to WaterAlert      

See this graph on the Monitoring Location Pages


Daily discharge, cubic feet per second -- statistics for Oct 25 based on 30 water years of record more
Min
(1994)
25th
percen-
tile
Median Mean 75th
percen-
tile
Most Recent
Instantaneous
Value Oct 25
Max
(2011)
204 259 343 457 647 1010 1130


Gage height, feet

Most recent instantaneous value: 34.13 10-24-2025   22:00 PDT
Graph of  Gage height, feet

Add up to 2 more sites and replot for "Gage height, feet"

?


Create presentation-quality / stand-alone graph.   Subscribe to WaterAlert      

See this graph on the Monitoring Location Pages


Turbidity, water, unfiltered, monochrome near infra-red LED light, 780-900 nm, detection angle 90 +-2.5 degrees, formazin nephelometric units (FNU)

Most recent instantaneous value: 1020 10-24-2025   22:00 PDT
Graph of  Turbidity, water, unfiltered, monochrome near infra-red LED light, 780-900 nm, detection angle 90 +-2.5 degrees, formazin nephelometric units (FNU)

Add up to 2 more sites and replot for "Turbidity, water, unfiltered, monochrome near infra-red LED light, 780-900 nm, detection angle 90 +-2.5 degrees, formazin nephelometric units (FNU)"

?


Create presentation-quality / stand-alone graph.   Subscribe to WaterAlert      

See this graph on the Monitoring Location Pages