USGS 360500114465601 LAKE MEAD BOULDER BASIN ET STATION

PROVISIONAL DATA SUBJECT TO REVISION

This station managed by the NV Water Science Center -- Henderson Studies.

Available Parameters Available Period
  
2010-03-03  2026-02-20
2010-03-03  2026-02-04
2010-03-03  2026-02-20
2010-03-15  2012-01-26
2021-01-01  2026-02-20
2010-03-03  2026-02-20
2010-03-01  2026-02-20
2010-03-01  2026-02-20
2010-03-03  2026-02-20
2021-01-01  2026-02-20


 (7)
 

  -- or --


Summary of all available data for this site
Instantaneous-data availability statement


Temperature, air, degrees Celsius

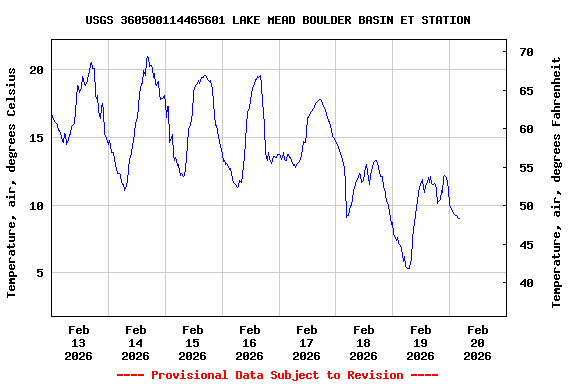
Most recent instantaneous value: 9.0 02-20-2026   04:00 PST
Graph of  Temperature, air, degrees Celsius

Add up to 2 more sites and replot for "Temperature, air, degrees Celsius"

?


Create presentation-quality / stand-alone graph.   Subscribe to WaterAlert      

See this graph on the Monitoring Location Pages


Wind direction, degrees clockwise from true north
 
-- Data temporarily unavailable for the time period specified --


Relative humidity, percent

Most recent instantaneous value: 44.0 02-20-2026   04:00 PST
Graph of  Relative humidity, percent

Add up to 2 more sites and replot for "Relative humidity, percent"

?


Create presentation-quality / stand-alone graph.   Subscribe to WaterAlert      

See this graph on the Monitoring Location Pages


Precipitation total for defined period, inches
 
-- Data temporarily unavailable for the time period specified --


Net solar radiation, watts per square meter

Most recent instantaneous value: -86 02-20-2026   04:00 PST
Graph of  Net solar radiation, watts per square meter

Add up to 2 more sites and replot for "Net solar radiation, watts per square meter"

?


Create presentation-quality / stand-alone graph.   Subscribe to WaterAlert      

See this graph on the Monitoring Location Pages


Wind speed, meters per second

Most recent instantaneous value: 6.23 02-20-2026   04:00 PST
Graph of  Wind speed, meters per second

Add up to 2 more sites and replot for "Wind speed, meters per second"

?


Create presentation-quality / stand-alone graph.   Subscribe to WaterAlert      

See this graph on the Monitoring Location Pages


Latent-heat flux, watts per square meter

Most recent instantaneous value: 159 02-20-2026   04:00 PST
Graph of

Add up to 2 more sites and replot for "Latent-heat flux, watts per square meter"

?


Create presentation-quality / stand-alone graph.   Subscribe to WaterAlert      

See this graph on the Monitoring Location Pages


Sensible-heat flux, watts per square meter

Most recent instantaneous value: 41.8 02-20-2026   04:00 PST
Graph of  Sensible-heat flux, watts per square meter

Add up to 2 more sites and replot for "Sensible-heat flux, watts per square meter"

?


Create presentation-quality / stand-alone graph.   Subscribe to WaterAlert      

See this graph on the Monitoring Location Pages


Atmospheric water vapor density, grams per cubic meter

Most recent instantaneous value: 3.52587100 02-20-2026   04:00 PST
Graph of

Add up to 2 more sites and replot for "Atmospheric water vapor density, grams per cubic meter"

?


Create presentation-quality / stand-alone graph.   Subscribe to WaterAlert      

See this graph on the Monitoring Location Pages


Evaporation per recording interval, millimeters, [Unadjusted for energy balance]

Most recent instantaneous value: 0.1153 02-20-2026   04:00 PST
Graph of

Add up to 2 more sites and replot for "Evaporation per recording interval, millimeters, [Unadjusted for energy balance]"

?


Create presentation-quality / stand-alone graph.   Subscribe to WaterAlert      

See this graph on the Monitoring Location Pages