USGS 391336106455801 VAN HORN PARK MET STATION NEAR ASPEN, CO

PROVISIONAL DATA SUBJECT TO REVISION

Available Parameters Available Period
  
2023-06-27  2026-02-22
2023-06-27  2026-02-22
2023-06-27  2026-02-22
2023-06-27  2026-02-22
2023-06-27  2026-02-22
2023-06-27  2026-02-22
2023-06-28  2026-02-22
2023-06-28  2026-02-22
2023-06-28  2026-02-22
2023-06-27  2026-02-22
2023-06-27  2026-02-22
2023-06-27  2026-02-22
2023-07-03  2026-02-22
2023-06-27  2026-02-22


 (7)
 

  -- or --


Summary of all available data for this site
Instantaneous-data availability statement


Temperature, air, degrees Celsius

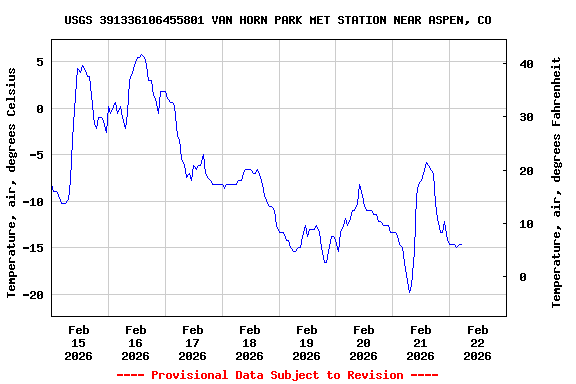
Most recent instantaneous value: -14.6 02-22-2026   05:02 MST
Graph of  Temperature, air, degrees Celsius

Add up to 2 more sites and replot for "Temperature, air, degrees Celsius"

?


Create presentation-quality / stand-alone graph.   Subscribe to WaterAlert      

See this graph on the Monitoring Location Pages


Relative humidity, percent

Most recent instantaneous value: 88.4 02-22-2026   05:02 MST
Graph of  Relative humidity, percent

Add up to 2 more sites and replot for "Relative humidity, percent"

?


Create presentation-quality / stand-alone graph.   Subscribe to WaterAlert      

See this graph on the Monitoring Location Pages


Soil temperature, degrees Celsius, [0.05 m depth CS655]

Most recent instantaneous value: -0.9 02-22-2026   05:02 MST
Graph of  Soil temperature, degrees Celsius, [0.05 m depth CS655]

Add up to 2 more sites and replot for "Soil temperature, degrees Celsius, [0.05 m depth CS655]"

?


Create presentation-quality / stand-alone graph.   Subscribe to WaterAlert      

See this graph on the Monitoring Location Pages


Soil temperature, degrees Celsius, [0.10 m depth CS655]

Most recent instantaneous value: -0.6 02-22-2026   05:02 MST
Graph of  Soil temperature, degrees Celsius, [0.10 m depth CS655]

Add up to 2 more sites and replot for "Soil temperature, degrees Celsius, [0.10 m depth CS655]"

?


Create presentation-quality / stand-alone graph.   Subscribe to WaterAlert      

See this graph on the Monitoring Location Pages


Soil temperature, degrees Celsius, [0.20 m depth CS655]

Most recent instantaneous value: -0.3 02-22-2026   05:02 MST
Graph of  Soil temperature, degrees Celsius, [0.20 m depth CS655]

Add up to 2 more sites and replot for "Soil temperature, degrees Celsius, [0.20 m depth CS655]"

?


Create presentation-quality / stand-alone graph.   Subscribe to WaterAlert      

See this graph on the Monitoring Location Pages


Soil temperature, degrees Celsius, [0.50 m depth CS655]

Most recent instantaneous value: 0.7 02-22-2026   05:02 MST
Graph of  Soil temperature, degrees Celsius, [0.50 m depth CS655]

Add up to 2 more sites and replot for "Soil temperature, degrees Celsius, [0.50 m depth CS655]"

?


Create presentation-quality / stand-alone graph.   Subscribe to WaterAlert      

See this graph on the Monitoring Location Pages


Cosmic ray neutron, count, [Blw ground surface, epi-therma]

Most recent instantaneous value: 6860 02-22-2026   05:02 MST
Graph of  Cosmic ray neutron, count, [Blw ground surface, epi-therma]

Add up to 2 more sites and replot for "Cosmic ray neutron, count, [Blw ground surface, epi-therma]"

?


Create presentation-quality / stand-alone graph.   Subscribe to WaterAlert      

See this graph on the Monitoring Location Pages


Cosmic ray neutron, count, [Epi-thermal neutron counts]

Most recent instantaneous value: 10519 02-22-2026   05:02 MST
Graph of  Cosmic ray neutron, count, [Epi-thermal neutron counts]

Add up to 2 more sites and replot for "Cosmic ray neutron, count, [Epi-thermal neutron counts]"

?


Create presentation-quality / stand-alone graph.   Subscribe to WaterAlert      

See this graph on the Monitoring Location Pages


Cosmic ray neutron, count, [Thermal neutron counts]

Most recent instantaneous value: 5299 02-22-2026   05:02 MST
Graph of  Cosmic ray neutron, count, [Thermal neutron counts]

Add up to 2 more sites and replot for "Cosmic ray neutron, count, [Thermal neutron counts]"

?


Create presentation-quality / stand-alone graph.   Subscribe to WaterAlert      

See this graph on the Monitoring Location Pages


Moisture content, soil, volumetric, percent of total volume, [0.05 m depth CS655]

Most recent instantaneous value: 8.6 02-22-2026   05:02 MST
Graph of  Moisture content, soil, volumetric, percent of total volume, [0.05 m depth CS655]

Add up to 2 more sites and replot for "Moisture content, soil, volumetric, percent of total volume, [0.05 m depth CS655]"

?


Create presentation-quality / stand-alone graph.   Subscribe to WaterAlert      

See this graph on the Monitoring Location Pages


Moisture content, soil, volumetric, percent of total volume, [0.10 m depth CS655]

Most recent instantaneous value: 9.4 02-22-2026   05:02 MST
Graph of  Moisture content, soil, volumetric, percent of total volume, [0.10 m depth CS655]

Add up to 2 more sites and replot for "Moisture content, soil, volumetric, percent of total volume, [0.10 m depth CS655]"

?


Create presentation-quality / stand-alone graph.   Subscribe to WaterAlert      

See this graph on the Monitoring Location Pages


Moisture content, soil, volumetric, percent of total volume, [0.20 m depth CS655]

Most recent instantaneous value: 13.0 02-22-2026   05:02 MST
Graph of  Moisture content, soil, volumetric, percent of total volume, [0.20 m depth CS655]

Add up to 2 more sites and replot for "Moisture content, soil, volumetric, percent of total volume, [0.20 m depth CS655]"

?


Create presentation-quality / stand-alone graph.   Subscribe to WaterAlert      

See this graph on the Monitoring Location Pages


Moisture content, soil, volumetric, percent of total volume, [0.50 m depth CS655]

Most recent instantaneous value: 8.8 02-22-2026   05:02 MST
Graph of  Moisture content, soil, volumetric, percent of total volume, [0.50 m depth CS655]

Add up to 2 more sites and replot for "Moisture content, soil, volumetric, percent of total volume, [0.50 m depth CS655]"

?


Create presentation-quality / stand-alone graph.   Subscribe to WaterAlert      

See this graph on the Monitoring Location Pages


Barometric pressure, not corrected to sea level, millibars

Most recent instantaneous value: 717 02-22-2026   05:02 MST
Graph of  Barometric pressure, not corrected to sea level, millibars

Add up to 2 more sites and replot for "Barometric pressure, not corrected to sea level, millibars"

?


Create presentation-quality / stand-alone graph.   Subscribe to WaterAlert      

See this graph on the Monitoring Location Pages