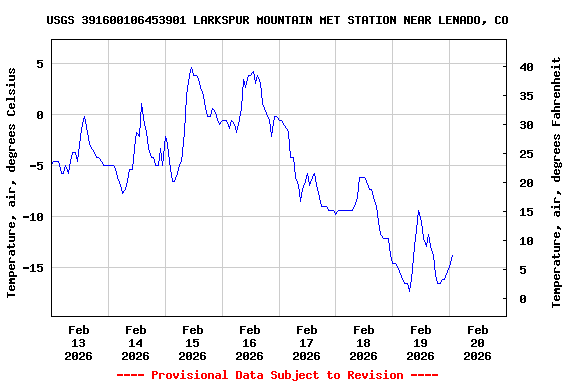
Most recent instantaneous value: -13.8 02-20-2026 01:02 MST
See this graph on the Monitoring Location Pages
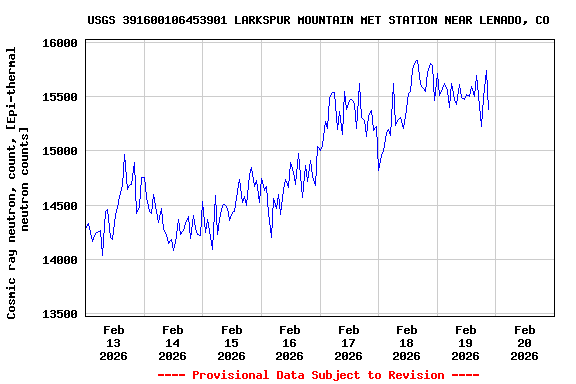
Cosmic ray neutron, count, [Blw ground surface, epi-therma] |
||
|
||
![Graph of Moisture content, soil, volumetric, percent of total volume, [0.05 m depth CS655]](https://natwebsdww02.cr.usgs.gov/nwisweb/data/img/USGS.391600106453901.330978.74207..20260213.20260220..0..gif)
![Graph of Moisture content, soil, volumetric, percent of total volume, [0.10 m depth CS655]](https://natwebsdww02.cr.usgs.gov/nwisweb/data/img/USGS.391600106453901.330979.74207..20260213.20260220..0..gif)
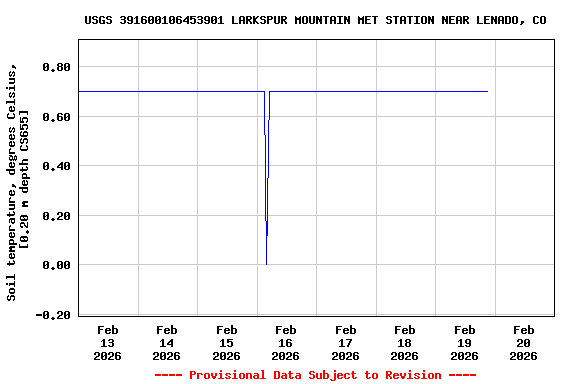
![Graph of Moisture content, soil, volumetric, percent of total volume, [0.20 m depth CS655]](https://natwebsdww02.cr.usgs.gov/nwisweb/data/img/USGS.391600106453901.330980.74207..20260213.20260220..0..gif)
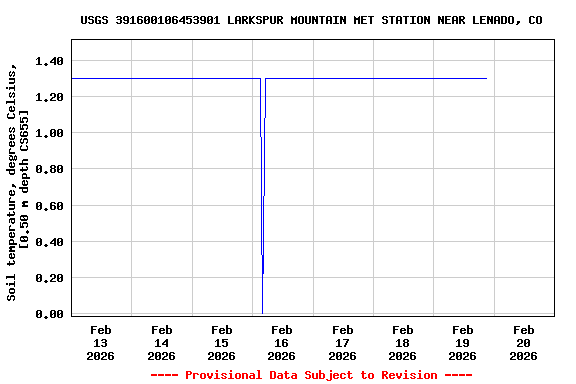
![Graph of Moisture content, soil, volumetric, percent of total volume, [0.50 m depth CS655]](https://natwebsdww02.cr.usgs.gov/nwisweb/data/img/USGS.391600106453901.330981.74207..20260213.20260220..0..gif)
![]() U.S. Department of the Interior |
U.S. Geological Survey
U.S. Department of the Interior |
U.S. Geological Survey
Title: USGS Current Conditions for the Nation
URL:
Page Contact Information: Colorado Water Data Support Team
Page Last Modified: 2026-02-20 10:19:27 EST
9.6 7.94 sdww02