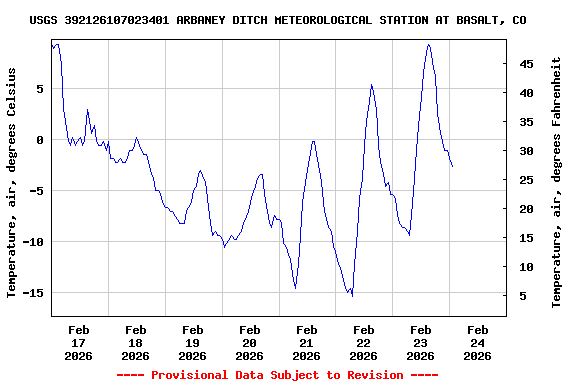
USGS 392126107023401 ARBANEY DITCH METEOROLOGICAL STATION AT BASALT, CO

PROVISIONAL DATA SUBJECT TO REVISION

Available Parameters Available Period
  
2023-07-02  2026-02-20
2023-07-02  2026-02-20
2023-07-02  2026-02-20
2023-07-02  2026-02-20
2023-07-02  2026-02-20
2023-07-02  2026-02-20
2023-07-02  2026-02-20
2023-07-02  2026-02-20
2023-07-02  2026-02-20
2023-07-02  2026-02-20
2023-07-02  2026-02-20
2023-07-02  2026-02-20
2023-07-02  2026-02-20


 (7)
 

  -- or --


Summary of all available data for this site
Instantaneous-data availability statement


Temperature, air, degrees Celsius

Most recent instantaneous value: -3.4 02-20-2026   17:02 MST
Graph of  Temperature, air, degrees Celsius

Add up to 2 more sites and replot for "Temperature, air, degrees Celsius"

?


Create presentation-quality / stand-alone graph.   Subscribe to WaterAlert      

See this graph on the Monitoring Location Pages


Relative humidity, percent

Most recent instantaneous value: 74.0 02-20-2026   17:02 MST
Graph of  Relative humidity, percent

Add up to 2 more sites and replot for "Relative humidity, percent"

?


Create presentation-quality / stand-alone graph.   Subscribe to WaterAlert      

See this graph on the Monitoring Location Pages


Soil temperature, degrees Celsius, [0.05 m depth CS655]

Most recent instantaneous value: 0.0 02-20-2026   17:02 MST
Graph of  Soil temperature, degrees Celsius, [0.05 m depth CS655]

Add up to 2 more sites and replot for "Soil temperature, degrees Celsius, [0.05 m depth CS655]"

?


Create presentation-quality / stand-alone graph.   Subscribe to WaterAlert      

See this graph on the Monitoring Location Pages


Soil temperature, degrees Celsius, [0.10 m depth CS655]

Most recent instantaneous value: 0.0 02-20-2026   17:02 MST
Graph of  Soil temperature, degrees Celsius, [0.10 m depth CS655]

Add up to 2 more sites and replot for "Soil temperature, degrees Celsius, [0.10 m depth CS655]"

?


Create presentation-quality / stand-alone graph.   Subscribe to WaterAlert      

See this graph on the Monitoring Location Pages


Soil temperature, degrees Celsius, [0.20 m depth CS655]

Most recent instantaneous value: 0.4 02-20-2026   17:02 MST
Graph of  Soil temperature, degrees Celsius, [0.20 m depth CS655]

Add up to 2 more sites and replot for "Soil temperature, degrees Celsius, [0.20 m depth CS655]"

?


Create presentation-quality / stand-alone graph.   Subscribe to WaterAlert      

See this graph on the Monitoring Location Pages


Soil temperature, degrees Celsius, [0.50 m depth CS655]

Most recent instantaneous value: 1.3 02-20-2026   17:02 MST
Graph of  Soil temperature, degrees Celsius, [0.50 m depth CS655]

Add up to 2 more sites and replot for "Soil temperature, degrees Celsius, [0.50 m depth CS655]"

?


Create presentation-quality / stand-alone graph.   Subscribe to WaterAlert      

See this graph on the Monitoring Location Pages


Cosmic ray neutron, count, [Epi-thermal neutron counts]

Most recent instantaneous value: 8516 02-20-2026   17:02 MST
Graph of  Cosmic ray neutron, count, [Epi-thermal neutron counts]

Add up to 2 more sites and replot for "Cosmic ray neutron, count, [Epi-thermal neutron counts]"

?


Create presentation-quality / stand-alone graph.   Subscribe to WaterAlert      

See this graph on the Monitoring Location Pages


Cosmic ray neutron, count, [Thermal neutron counts]

Most recent instantaneous value: 3862 02-20-2026   17:02 MST
Graph of  Cosmic ray neutron, count, [Thermal neutron counts]

Add up to 2 more sites and replot for "Cosmic ray neutron, count, [Thermal neutron counts]"

?


Create presentation-quality / stand-alone graph.   Subscribe to WaterAlert      

See this graph on the Monitoring Location Pages


Moisture content, soil, volumetric, percent of total volume, [0.05 m depth CS655]

Most recent instantaneous value: 31.0 02-20-2026   17:02 MST
Graph of  Moisture content, soil, volumetric, percent of total volume, [0.05 m depth CS655]

Add up to 2 more sites and replot for "Moisture content, soil, volumetric, percent of total volume, [0.05 m depth CS655]"

?


Create presentation-quality / stand-alone graph.   Subscribe to WaterAlert      

See this graph on the Monitoring Location Pages


Moisture content, soil, volumetric, percent of total volume, [0.10 m depth CS655]

Most recent instantaneous value: 30.8 02-20-2026   17:02 MST
Graph of  Moisture content, soil, volumetric, percent of total volume, [0.10 m depth CS655]

Add up to 2 more sites and replot for "Moisture content, soil, volumetric, percent of total volume, [0.10 m depth CS655]"

?


Create presentation-quality / stand-alone graph.   Subscribe to WaterAlert      

See this graph on the Monitoring Location Pages


Moisture content, soil, volumetric, percent of total volume, [0.20 m depth CS655]

Most recent instantaneous value: 20.6 02-20-2026   17:02 MST
Graph of  Moisture content, soil, volumetric, percent of total volume, [0.20 m depth CS655]

Add up to 2 more sites and replot for "Moisture content, soil, volumetric, percent of total volume, [0.20 m depth CS655]"

?


Create presentation-quality / stand-alone graph.   Subscribe to WaterAlert      

See this graph on the Monitoring Location Pages


Moisture content, soil, volumetric, percent of total volume, [0.50 m depth CS655]

Most recent instantaneous value: 5.4 02-20-2026   17:02 MST
Graph of  Moisture content, soil, volumetric, percent of total volume, [0.50 m depth CS655]

Add up to 2 more sites and replot for "Moisture content, soil, volumetric, percent of total volume, [0.50 m depth CS655]"

?


Create presentation-quality / stand-alone graph.   Subscribe to WaterAlert      

See this graph on the Monitoring Location Pages


Barometric pressure, not corrected to sea level, millibars

Most recent instantaneous value: 789 02-20-2026   17:02 MST
Graph of  Barometric pressure, not corrected to sea level, millibars

Add up to 2 more sites and replot for "Barometric pressure, not corrected to sea level, millibars"

?


Create presentation-quality / stand-alone graph.   Subscribe to WaterAlert      

See this graph on the Monitoring Location Pages