USGS 02323000 SUWANNEE RIVER NEAR BELL, FLORIDA

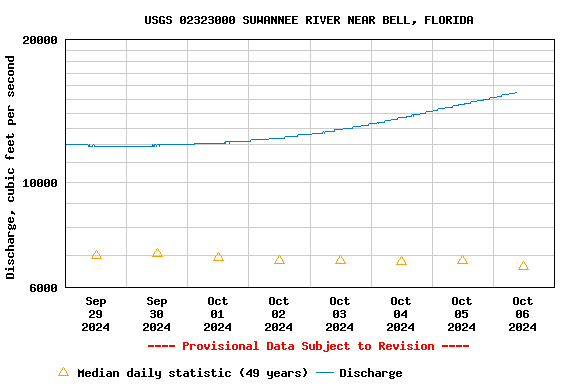
PROVISIONAL DATA SUBJECT TO REVISION

Click to hidestation-specific text

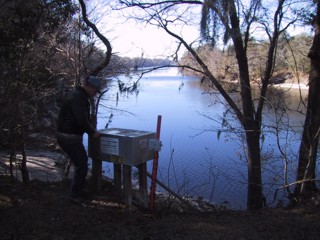
This gage is monitored as part of the National Groundwater and Streamflow Information Program.

Link to the National Groundwater and Streamflow Information Program

Hydrographer servicing gage on January 4, 2002. Link to the Suwannee River Water Management District

January 4, 2002. Link to the Suwannee River Water Management District

Available Parameters Available Period
  
2021-02-25  2025-03-16
2000-08-04  2025-03-16
2007-10-01  2025-03-16
2021-02-25  2025-03-16


 (7)
 

  -- or --


Summary of all available data for this site
Instantaneous-data availability statement


Temperature, water, degrees Celsius

Most recent instantaneous value: 18.5 03-16-2025   06:00 EDT
Graph of  Temperature, water, degrees Celsius

Add up to 2 more sites and replot for "Temperature, water, degrees Celsius"

?


Create presentation-quality / stand-alone graph.   Subscribe to WaterAlert      

See this graph on the Monitoring Location Pages


Discharge, cubic feet per second

Most recent instantaneous value: 11600 03-16-2025   06:00 EDT
Graph of  Discharge, cubic feet per second

Add up to 2 more sites and replot for "Discharge, cubic feet per second"

?


Create presentation-quality / stand-alone graph.   Subscribe to WaterAlert      

See this graph on the Monitoring Location Pages


Daily discharge, cubic feet per second -- statistics for Mar 16 based on 48 water years of record more
Min
(1955)
25th
percen-
tile
Median Mean Most Recent
Instantaneous
Value Mar 16
75th
percen-
tile
Max
(1948)
3460 5640 10200 11300 11600 14300 35000


Gage height, feet

Most recent instantaneous value: 12.86 03-16-2025   06:00 EDT
Graph of  Gage height, feet

Add up to 2 more sites and replot for "Gage height, feet"

?


Create presentation-quality / stand-alone graph.   Subscribe to WaterAlert      

See this graph on the Monitoring Location Pages


Specific conductance, water, unfiltered, microsiemens per centimeter at 25 degrees Celsius

Most recent instantaneous value: 113 03-16-2025   06:00 EDT
Graph of  Specific conductance, water, unfiltered, microsiemens per centimeter at 25 degrees Celsius

Add up to 2 more sites and replot for "Specific conductance, water, unfiltered, microsiemens per centimeter at 25 degrees Celsius"

?


Create presentation-quality / stand-alone graph.   Subscribe to WaterAlert      

See this graph on the Monitoring Location Pages