USGS 02326050 ECONFINA RV AT ECONFINA RV STATE PARK NR PERRY, FL

PROVISIONAL DATA SUBJECT TO REVISION

Click to hidestation-specific text

This gage is monitored in cooperation with the Suwannee River Water Management District.

Link to the Suwannee River Water Management District

Available Parameters Available Period
  
2021-03-04  2024-10-06
2021-03-04  2023-05-23
2021-03-04  2024-10-06
2021-03-04  2024-10-06
2021-03-04  2023-05-23
2021-03-04  2024-10-06
2023-01-01  2024-10-04


 (7)
 

  -- or --


Summary of all available data for this site
Instantaneous-data availability statement


Temperature, water, degrees Celsius, Bottom, [BOTTOM]

Most recent instantaneous value: 25.3 10-06-2024   07:45 EDT
Graph of  Temperature, water, degrees Celsius, [BOTTOM]

Add up to 2 more sites and replot for "Temperature, water, degrees Celsius, Bottom, [BOTTOM]"

?


Create presentation-quality / stand-alone graph.   Subscribe to WaterAlert      

See this graph on the Monitoring Location Pages


Temperature, water, degrees Celsius, Top, [TOP]
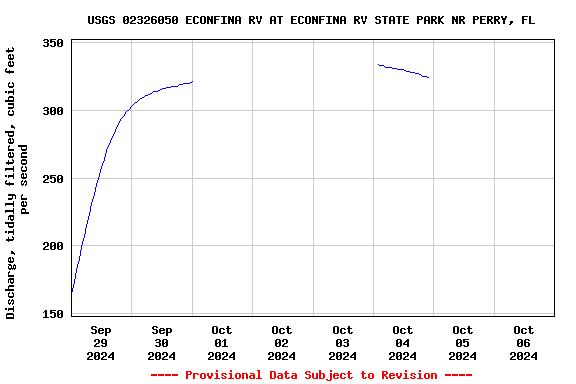
 
-- Data temporarily unavailable for the time period specified --


Discharge, cubic feet per second

Most recent instantaneous value: 347 10-06-2024   07:45 EDT
Graph of  Discharge, cubic feet per second

Add up to 2 more sites and replot for "Discharge, cubic feet per second"

?


Create presentation-quality / stand-alone graph.   Subscribe to WaterAlert      

See this graph on the Monitoring Location Pages


Daily discharge, cubic feet per second -- statistics for Oct 6 based on 2 water years of record more
Min
(2023)
Mean Median Most Recent
Instantaneous
Value Oct 6
Max
(2022)
150 280 280 347 409


Gage height, feet

Most recent instantaneous value: 1.87 10-06-2024   07:45 EDT
Graph of  Gage height, feet

Add up to 2 more sites and replot for "Gage height, feet"

?


Create presentation-quality / stand-alone graph.   Subscribe to WaterAlert      

See this graph on the Monitoring Location Pages


Specific conductance, water, unfiltered, microsiemens per centimeter at 25 degrees Celsius, Bottom, [Bottom]

Most recent instantaneous value: 166 10-06-2024   07:45 EDT
Graph of  Specific conductance, water, unfiltered, microsiemens per centimeter at 25 degrees Celsius, [Bottom]

Add up to 2 more sites and replot for "Specific conductance, water, unfiltered, microsiemens per centimeter at 25 degrees Celsius, Bottom, [Bottom]"

?


Create presentation-quality / stand-alone graph.   Subscribe to WaterAlert      

See this graph on the Monitoring Location Pages


Specific conductance, water, unfiltered, microsiemens per centimeter at 25 degrees Celsius, Top, [TOP]
 
-- Data temporarily unavailable for the time period specified --


Discharge, tidally filtered, cubic feet per second

Most recent instantaneous value: 325 10-04-2024   20:00 EDT
Graph of  Discharge, tidally filtered, cubic feet per second

Add up to 2 more sites and replot for "Discharge, tidally filtered, cubic feet per second"

?


Create presentation-quality / stand-alone graph.   Subscribe to WaterAlert      

See this graph on the Monitoring Location Pages