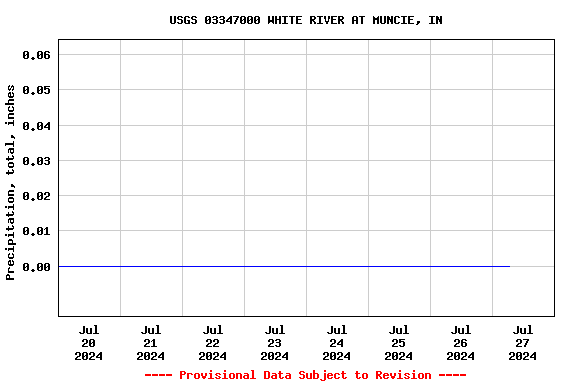
Most recent instantaneous value: 0.00 07-27-2024 05:30 EST
See this graph on the Monitoring Location Pages
Click here to view flood inundation maps for this gaging station.
This gaging station is maintained in cooperation with:
| Boating safety tips |
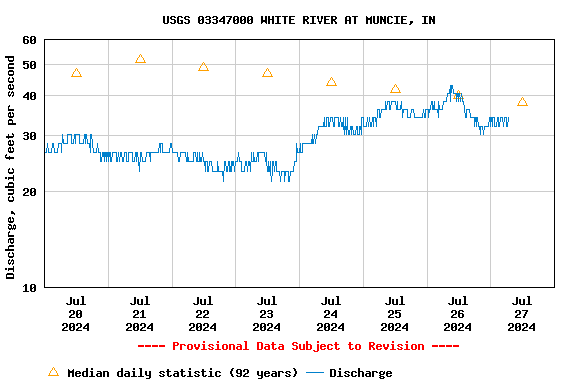
| Min (1934) | 25th percen- tile | Most Recent Instantaneous Value Jul 27 | Median | Mean | 75th percen- tile | Max (1979) |
|---|---|---|---|---|---|---|
| 1.60 | 21 | 34.2 | 38 | 94 | 107 | 2530 |
![]() U.S. Department of the Interior |
U.S. Geological Survey
U.S. Department of the Interior |
U.S. Geological Survey
Title: USGS Current Conditions for the Nation
URL:
Page Contact Information: Indiana Water Data Support Team
Page Last Modified: 2024-07-27 06:42:44 EDT
2.12 1.9 sdww01