USGS 03460795 PIGEON R BL POWER PLANT NR WATERVILLE, NC

PROVISIONAL DATA SUBJECT TO REVISION

Click to hidestation-specific text
Duke Energy Logo 
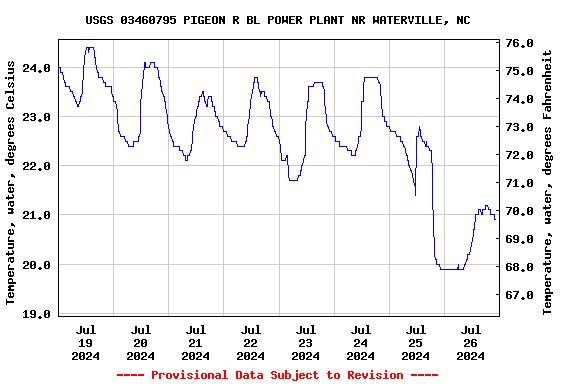
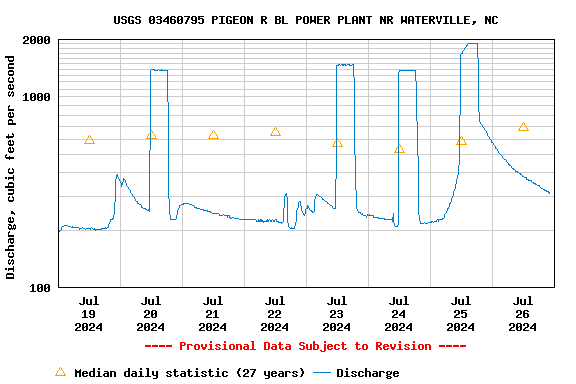
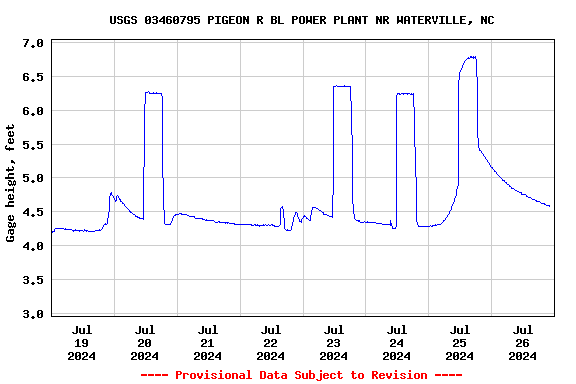
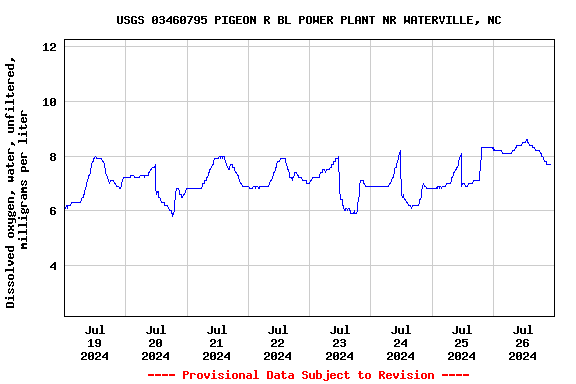
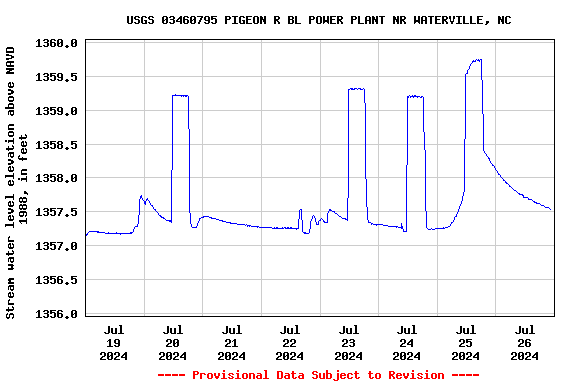
This station is operated in cooperation with Duke Energy.

Water-quality data collected seasonally from June through September.
This station managed by the South Atlantic WSC Asheville Field Office.

Available Parameters Available Period
  
2008-05-30  2024-07-26
1997-02-04  2024-07-26
2007-10-01  2024-07-26
2008-05-30  2024-07-26
2021-10-01  2024-07-26


 (7)
 

  -- or --


Summary of all available data for this site
Instantaneous-data availability statement


Temperature, water, degrees Celsius

Most recent instantaneous value: 21.0 07-26-2024   21:15 EDT
Graph of  Temperature, water, degrees Celsius

Add up to 2 more sites and replot for "Temperature, water, degrees Celsius"

?


Create presentation-quality / stand-alone graph.   Subscribe to WaterAlert      

See this graph on the Monitoring Location Pages


Discharge, cubic feet per second

Most recent instantaneous value: 319 07-26-2024   21:15 EDT
Graph of  Discharge, cubic feet per second

Add up to 2 more sites and replot for "Discharge, cubic feet per second"

?


Create presentation-quality / stand-alone graph.   Subscribe to WaterAlert      

See this graph on the Monitoring Location Pages


Daily discharge, cubic feet per second -- statistics for Jul 26 based on 27 water years of record more
Min
(1998)
Most Recent
Instantaneous
Value Jul 26
25th
percen-
tile
Median Mean 75th
percen-
tile
Max
(2005)
140 319 551 693 717 1030 1360


Gage height, feet

Most recent instantaneous value: 4.60 07-26-2024   21:15 EDT
Graph of  Gage height, feet

Add up to 2 more sites and replot for "Gage height, feet"

?


Create presentation-quality / stand-alone graph.   Subscribe to WaterAlert      

See this graph on the Monitoring Location Pages


Dissolved oxygen, water, unfiltered, milligrams per liter

Most recent instantaneous value: 7.7 07-26-2024   21:15 EDT
Graph of  Dissolved oxygen, water, unfiltered, milligrams per liter

Add up to 2 more sites and replot for "Dissolved oxygen, water, unfiltered, milligrams per liter"

?


Create presentation-quality / stand-alone graph.   Subscribe to WaterAlert      

See this graph on the Monitoring Location Pages


Stream water level elevation above NAVD 1988, in feet

Most recent instantaneous value: 1357.56 07-26-2024   21:15 EDT
Graph of  Stream water level elevation above NAVD 1988, in feet

Add up to 2 more sites and replot for "Stream water level elevation above NAVD 1988, in feet"

?


Create presentation-quality / stand-alone graph.   Subscribe to WaterAlert      

See this graph on the Monitoring Location Pages