Most recent instantaneous value: 10.1 10-06-2024 04:45 MDT
See this graph on the Monitoring Location Pages
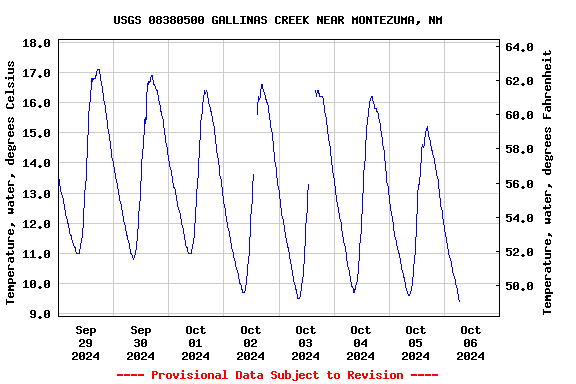
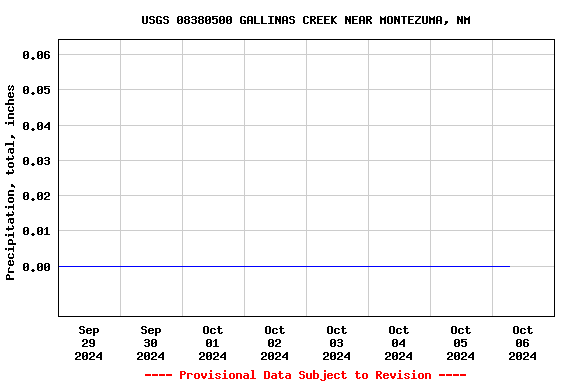
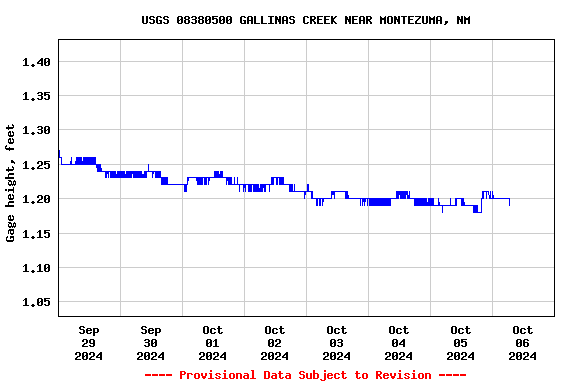
| Station operated in cooperation with the New Mexico
Office of the State Engineer. |
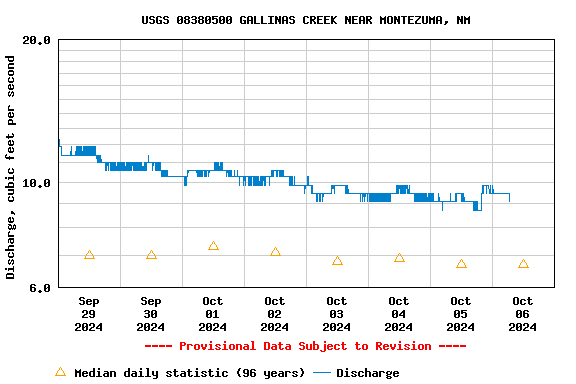
| Min (1957) | 25th percen- tile | Median | Most Recent Instantaneous Value Oct 6 | 75th percen- tile | Mean | Max (2018) |
|---|---|---|---|---|---|---|
| 0.30 | 4 | 6.7 | 9.48 | 12 | 13 | 180 |
![]() U.S. Department of the Interior |
U.S. Geological Survey
U.S. Department of the Interior |
U.S. Geological Survey
Title: USGS Current Conditions for the Nation
URL:
Page Contact Information: New Mexico Water Data Support Team
Page Last Modified: 2024-10-06 07:35:34 EDT
8.76 7.41 vaww02