PROVISIONAL DATA SUBJECT TO REVISION
Click to hidestation-specific text
Funding for this site is provided by:
 Site Information
LOCATION.--Lat 42°06'07.3", long
74°18'39.2" referenced to North American Datum of
1983, Ulster County, NY, Hydrologic Unit 02020006, on left bank
below Ox Clove, 10 ft downstream from bridge on State Highway
214, and 1.8 mi upstream from mouth, at Chichester.
DRAINAGE AREA.--30.9 mi².
PERIOD OF RECORD.--Annual maximum only--1997, February 1997 to current year. Prior to October 2006, published as "near Phoenicia" (01362380).
REVISIONS HISTORY.--WDR NY-99-1: 1997(P), 1998(P).
GAGE.--Water-stage recorder, crest-stage gage, and concrete control. Datum of gage is 947.52 ft above NAVD of 1988. Prior to Aug. 7, 2007, at site 0.5 mi downstream at datum 55.48 ft lower.
REMARKS.--Water Years 2014-23: Records fair except those for estimated daily discharges, which are poor.
EXTREMES FOR PERIOD OF RECORD.--Maximum discharge, 14,300 ft³/s, Aug. 28, 2011, gage height, 9.61 ft, from rating curve extended above 2,900 ft³/s on basis of runoff comparison of slope-area measurement at gage height 7.92 ft (present site), from floodmarks, at site 250 ft upstream (drainage area, 26.9 mi²); maximum gage height, 10.33 ft, Apr. 2, 2005, site and datum then in use; minimum discharge, 2.49 ft³/s, Aug. 29, 30, 2022, gage height, 2.04 ft; minimum gage height, 1.96 ft, Aug. 31, Sept. 8, 9, 10, 2001, site and datum then in use.
EXTREMES OUTSIDE PERIOD OF RECORD.--Maximum discharge, 7,600 ft³/s, Apr. 4, 1987, by computation of slope-area measurement at site 250 ft upstream (drainage area, 26.9 mi²). Discharges for other floods by computation of slope-area measurements at site 1.8 mi downstream (drainage area, 33.3 mi²), are as follows: 6,560 ft³/s, Nov. 25, 1950, and 4,460 ft³/s, Apr. 5, 1952.
PERIOD OF RECORD1.--November 2010 to current year.
PERIOD OF DAILY RECORD1.--TURBIDITY: DTS12 - November 2010 to February 2011, May 2011 to August 2011, October 2011 to February 2012, October 2013 to current year. Analite - November 2022 to current year.
SUSPENDED-SEDIMENT CONCENTRATION: October 2016 to current year.
SUSPENDED-SEDIMENT DISCHARGE: October 2016 to current year.
INSTRUMENTATION1.--An optical turbidity sensor provides readings at 15-minute intervals since November 2010.
REMARKS1.--Turbidity data are collected every 15 minutes using an in situ turbidity probe located in the same pipe with the automatic sampler intake tubing which is a 2 inch diameter galvanized steel pipe extending 3 ft from the left bank. Daily suspended-sediment load and concentration are derived from a regression equation relating turbidity to suspended-sediment concentration.
COOPERATION1.--In cooperation with the New York City Department of Environmental Protection.
EXTREMES FOR PERIOD OF DAILY RECORD1.--TURBIDITY: DTS12 - Maximum, 1,860 FNU, Dec. 1, 2010; minimum, <0.2 FNU, on many days. Analite - Maximum, 1,260 FNU, Oct. 7, 2023; minimum, <0.2FNU, Dec. 12, 2022, Apr. 20, June 6, Aug. 2, Nov. 4, 5, 6, 8, 2023. [<, actual value is known to be less than the value shown]
SUSPENDED-SEDIMENT CONCENTRATION: Maximum daily mean, 2,860 mg/L, Dec. 1, 2010; minimum daily mean, <1 mg/L, on Aug. 24, Sept. 1, 24, 28, 29, 2014. [<, actual value is known to be less than the value shown]
SUSPENDED-SEDIMENT DISCHARGE: Maximum daily, 8,860 tons, Sept. 18, 2012; minimum daily, <0.01 tons, Jan. 15, 16, 17, 2012, on many days in September 2013. [<, actual value is known to be less than the value shown]
1 Water-Quality Records
 WaterAlert – get an
email or text (SMS) alert based on your chosen threshold.
WaterAlert – get an
email or text (SMS) alert based on your chosen threshold.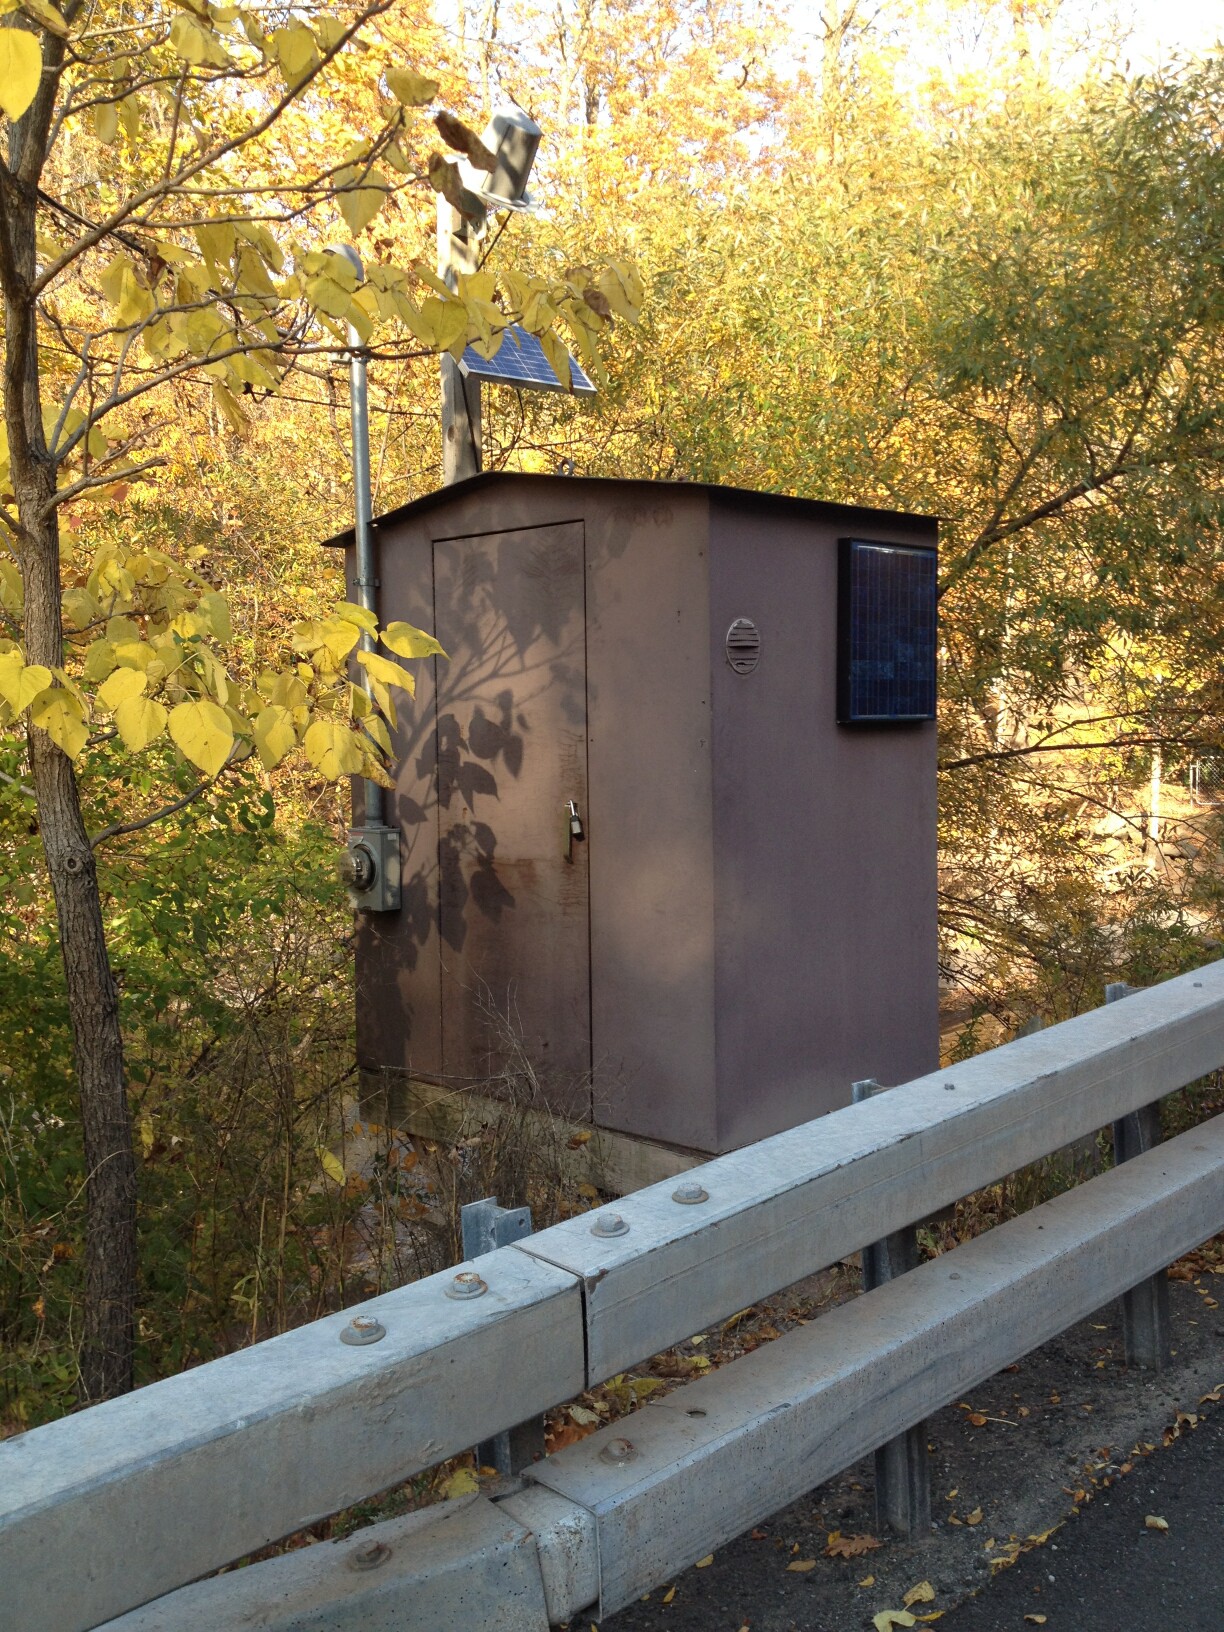 Station image
Summary of all available data for this site
Instantaneous-data availability statement

