PROVISIONAL DATA SUBJECT TO REVISION
Click to hidestation-specific text
Funding for this site is provided by:
 Site Information
LOCATION.--Lat 43°16'58.0", long
74°57'33.1" referenced to North American Datum of
1983, Herkimer County, NY, Hydrologic Unit 02020004, on right
bank 15 ft upstream from bridge on Reinhart Road, 1.3 mi
upstream of State Highway 8 bridge, and 1.4 mi northwest of
Gray.
DRAINAGE AREA.--60.9 mi².
PERIOD OF RECORD.--August 2014 to current year.
GAGE.--Water-stage recorder and crest-stage gage. Datum of gage is 1,224.74 ft above NAVD of 1988.
REMARKS.--Water Years 2015-24: Records fair except those for estimated daily discharges and those above 6,000 ft³/s, which are poor.
EXTREMES FOR PERIOD OF RECORD.--Maximum discharge, about 14,700 ft³/s, Nov. 1, 2019, gage height, 23.72 ft, from flood mark, from rating curve extended above 6,000 ft³/s; minimum discharge, 9.0 ft³/s, Sept. 12, 13, 23, 27, 28, 2020, gage height, 3.81 ft.
EXTREMES OUTSIDE PERIOD OF RECORD.--Outstanding floods occurred in August and September 2011. Flood in August or September 2011 reached a stage of about 19.9 ft, discharge not determined, from information by local resident.
 WaterAlert – get an
email or text (SMS) alert based on your chosen threshold.
WaterAlert – get an
email or text (SMS) alert based on your chosen threshold.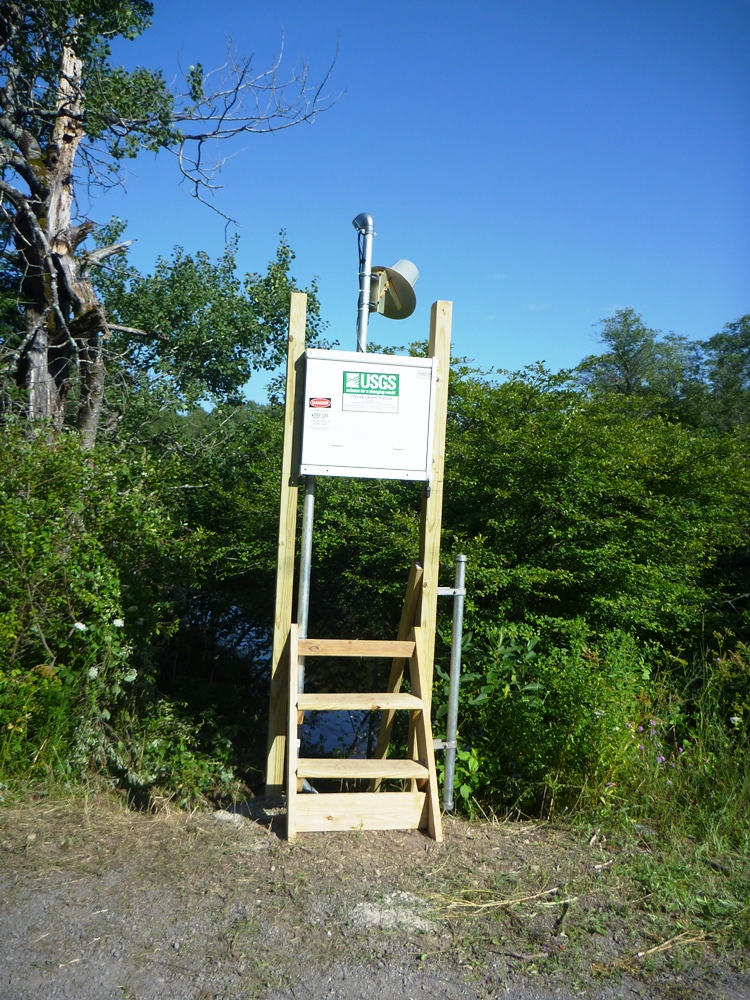 Station image
Summary of all available data for this site
Instantaneous-data availability statement

