PROVISIONAL DATA SUBJECT TO REVISION
Click to hidestation-specific text
Funding for this site is provided by:
 Site Information
LOCATION.--Lat 42°38'01.1", long
73°48'15.4" referenced to North American Datum of
1983, Albany County, NY, Hydrologic Unit 02020006, on left bank
0.35 mi upstream from bridge on Normans Kill Road at
Normansville, and 0.40 mi upstream from Delaware Avenue bridge,
in Albany.
DRAINAGE AREA.--168 mi².
PERIOD OF RECORD.--Occasional low-flow and/or miscellaneous discharge measurements, water years 1949, 1952, 1954, 1959, 1962-65, 1985. Annual maximum only--1984, 1992-2012, 2014-15. May 1979 to April 1983, July 2012 to February 2014, May 2015 to current year.
GAGE.--Water-stage recorder and crest-stage gage. Datum of gage is 85.86 ft above NAVD of 1988.
REMARKS.--Water Years 2014-22: Records good except those for estimated daily discharges, which are fair. Water Year 2023: Records fair except those for estimated daily discharges, which are poor.
EXTREMES FOR PERIOD OF RECORD.--Maximum discharge, 13,200 ft³/s, Aug. 28, 2011, gage height, 14.15 ft; minimum discharge, 7.2 ft³/s, Sept. 30, 2019, gage height, 2.69 ft; minimum gage height, 2.66 ft, on several days in September 2020.
EXTREMES OUTSIDE PERIOD OF RECORD.--Flood of Oct. 16, 1955, reached a discharge of about 13,600 ft³/s, on basis of runoff comparison of peak flow from contracted-opening measurement 3.3 mi upstream at station 01359525 (drainage area 163 mi²).
PERIOD OF DAILY RECORD1.--SUSPENDED-SEDIMENT DISCHARGE: August to September 2011, July 2012 to February 2014.
REMARKS1.--Turbidity data are collected every 5 minutes (15 minutes during the 2012 water year) using an in situ turbidity probe located about 1,500 ft downstream. Beginning in the 2012 water year, daily suspended load and concentration derived from a regression equation relating turbidity and streamflow to suspended-sediment concentration.
EXTREMES FOR PERIOD OF DAILY RECORD1.--SUSPENDED-SEDIMENT CONCENTRATION: Maximum daily mean, 2,280 mg/L, Aug. 28, 2011; minimum daily mean, 2 mg/L, July 19, 20, 22, 2012.
SUSPENDED-SEDIMENT DISCHARGE: Maximum daily, about 42,300 tons, Aug. 28, 2011; minimum daily, 0.17 tons, Sept. 16, 17, 2012.
1 Water-Quality Records
 WaterAlert – get an
email or text (SMS) alert based on your chosen threshold. Additional Site
Information
WaterAlert – get an
email or text (SMS) alert based on your chosen threshold. Additional Site
Information
Peak Flow and Stage Information
View water level data upstream of the April 2015 Normans Kill landslide (Normans Kill at Karlsfeld - 01359525)
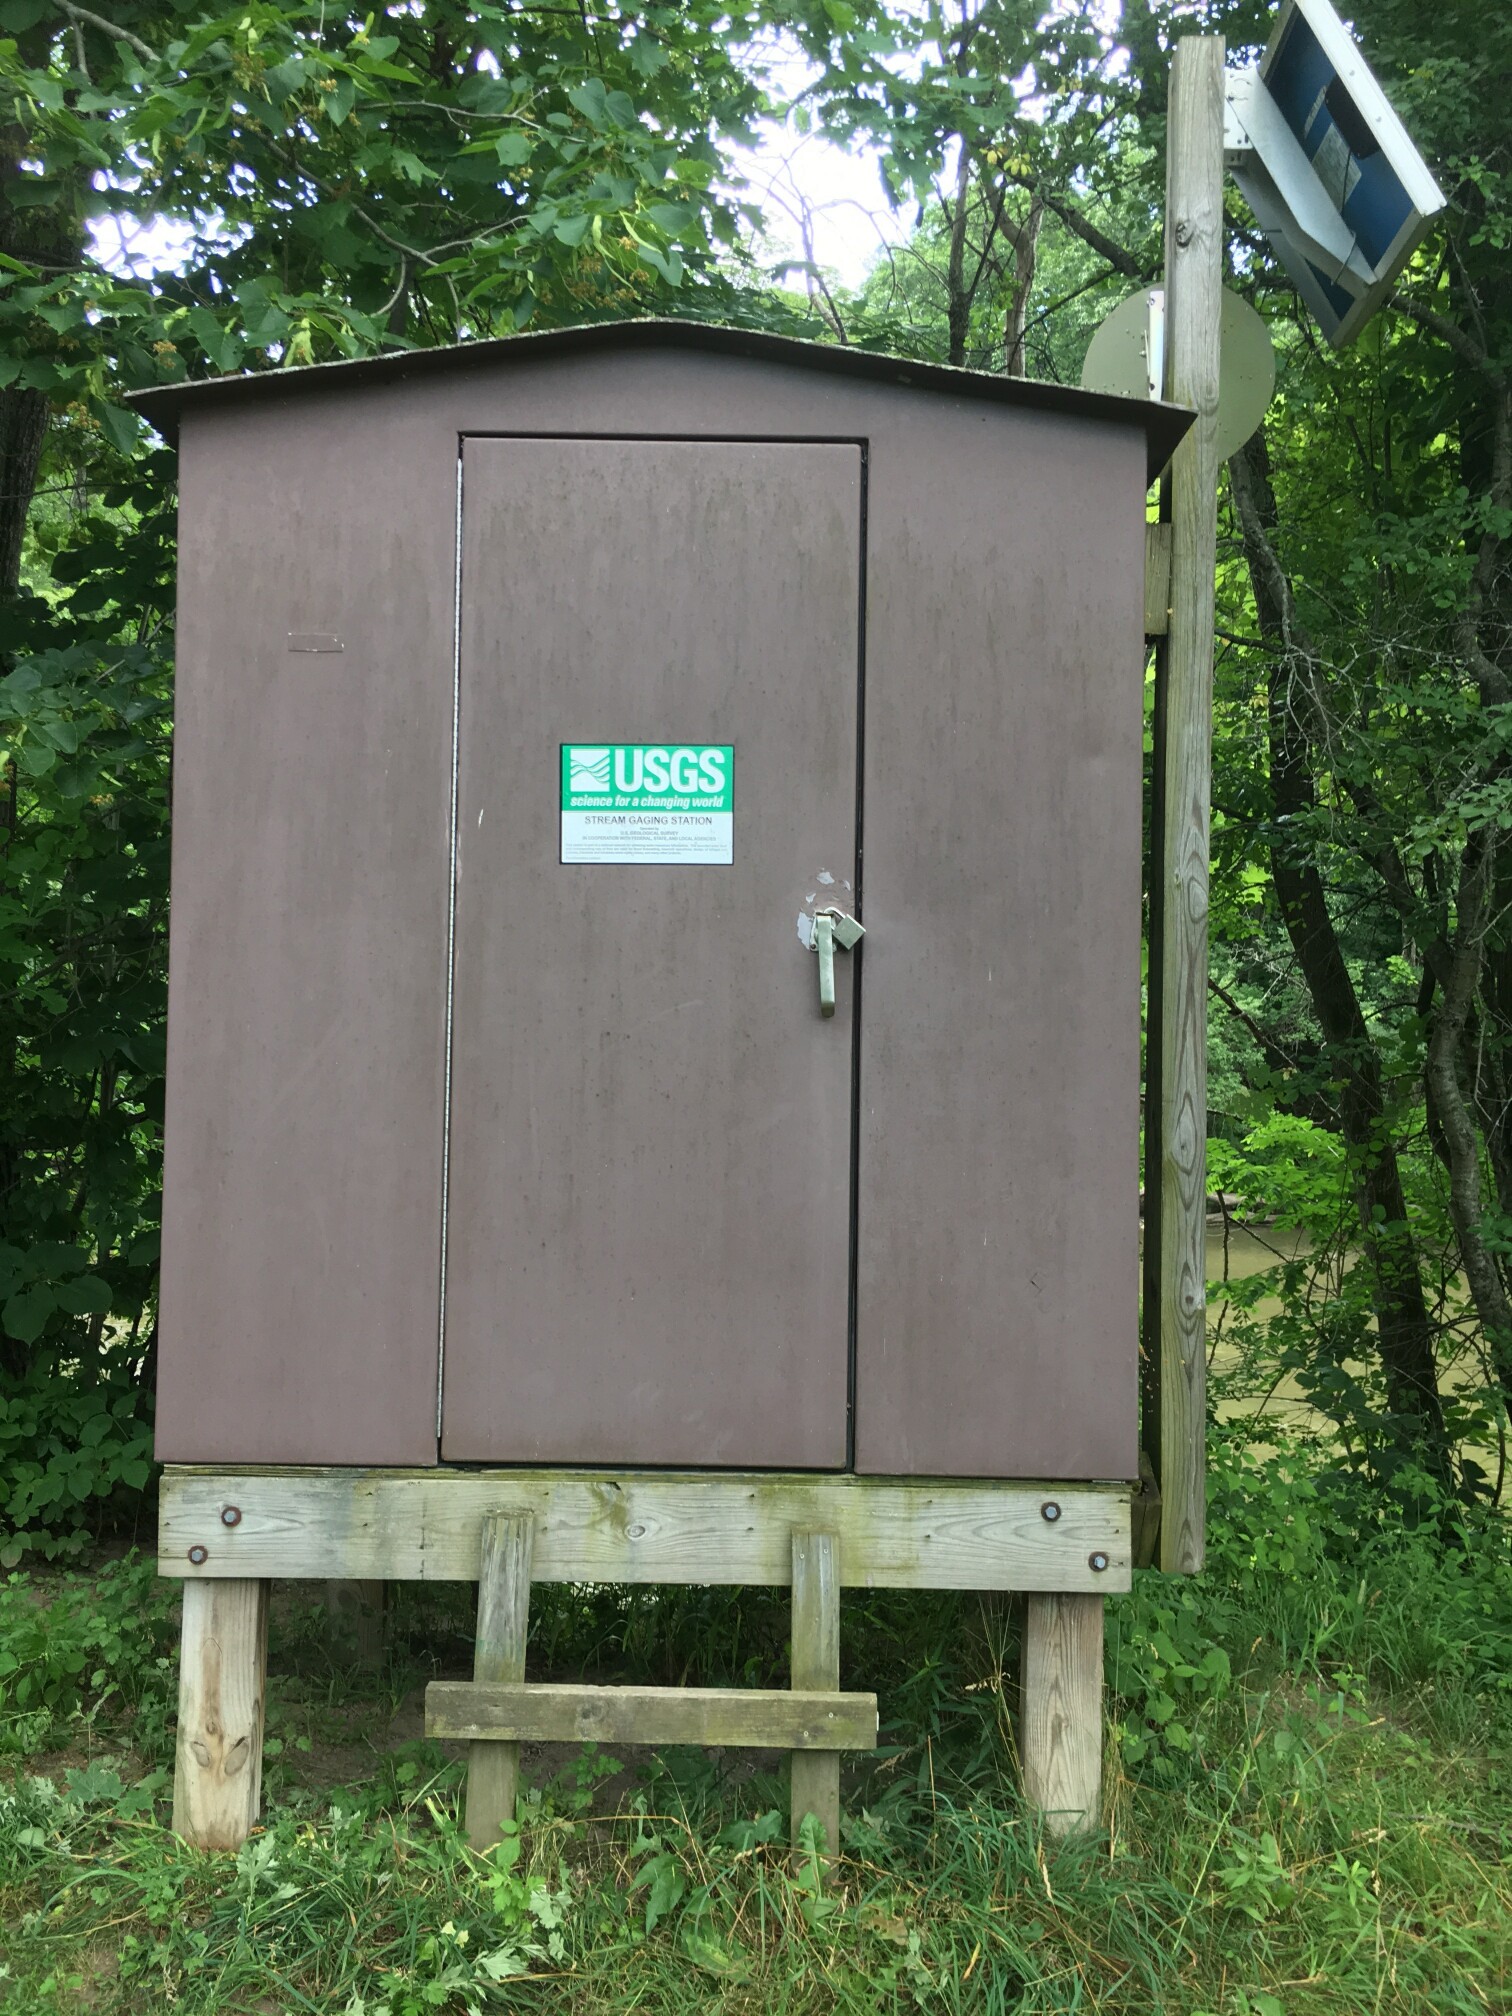 Station image
Summary of all available data for this site
Instantaneous-data availability statement


![Graph of Water surface elevation difference between two locations, feet, [Karlsfeld minus Albany]](https://natwebvaww02.er.usgs.gov/nwisweb/data/img/USGS.01359528.106993.99064..20240419.20240426..0..gif)