PROVISIONAL DATA SUBJECT TO REVISION
Click to hidestation-specific text
Funding for this site is provided by:
 Site Information
LOCATION.--Lat 41°50'42", long
74°32'22" referenced to North American Datum of 1983,
Sullivan County, NY, Hydrologic Unit 02020007, on right bank
600 ft downstream from Red Brook, and 0.6 mi upstream from
bridge on State Highway 55, in Grahamsville.
DRAINAGE AREA.--20.9 mi².
PERIOD OF RECORD.--October 1938 to March 1987, October 1998 to current year. Monthly discharge only for October 1938, published in WSP 1302. Occasional miscellaneous discharge measurements, water years 1987-89, 1991, 1997-98.
REVISIONS HISTORY.--Discharge for the period Oct. 1, 2018 to Sept. 30, 2019, was revised on Nov. 6, 2020, based on changes to the stage-discharge rating.
GAGE.--Water-stage recorder and crest-stage gage. Datum of gage is 878.96 ft above NGVD of 1929 and 878.31 ft above NAVD of 1988. Prior to October 1998, at datum 2.00 ft higher. Concrete control destroyed April 2005.
REMARKS.--Slight seasonal regulation caused by Beaverdam Pond on Red Brook.
Water Years 2014-20: Records fair. Water Years 2021-24: Records fair except those for estimated daily discharges and those above 100 ft³/s, which are poor.
EXTREMES FOR PERIOD OF RECORD.--Maximum discharge, 4,640 ft³/s, Oct. 15, 1955, gage height, 7.02 ft, present datum, from rating curve extended above 1,400 ft³/s on basis of slope-area measurement at gage height 6.68 ft, present datum; minimum discharge, 1.4 ft³/s, Nov. 1, 1964.
 WaterAlert – get an
email or text (SMS) alert based on your chosen threshold.
WaterAlert – get an
email or text (SMS) alert based on your chosen threshold.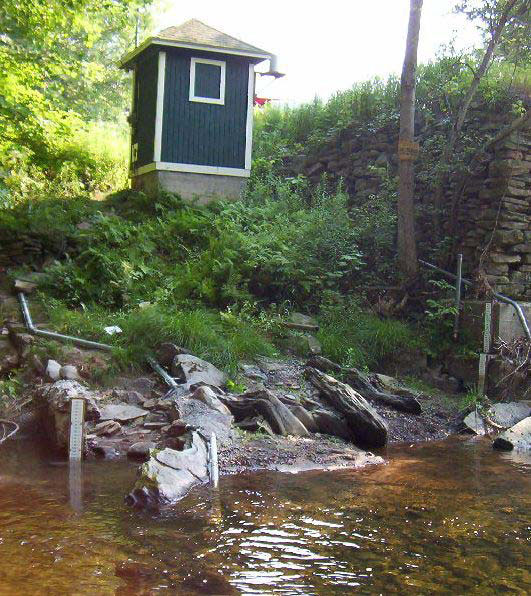 Station image
Summary of all available data for this site
Instantaneous-data availability statement

