PROVISIONAL DATA SUBJECT TO REVISION
Click to hidestation-specific text
Funding for this site is provided by:
 Site Information
LOCATION.--Lat 42°07'59", long
74°41'44" referenced to North American Datum of 1983,
Delaware County, NY, Hydrologic Unit 02040102, on right bank
200 ft upstream from bridge on State Highway 28 in Dunraven,
and 2.5 mi southeast of Margaretville.
DRAINAGE AREA.--34.9 mi².
PERIOD OF RECORD.--October 1941 to September 1962, annual maximum only--1996, maximum only--October to November 1996, December 1996 to current year.
REVISIONS HISTORY.--WDR NY-97-1: Drainage area. Discharge for the period Jan. 4, 2022, to Feb. 16, 2022, was revised on Sept. 19, 2022, based on changes to estimated discharge.
GAGE.--Water-stage recorder and crest-stage gage. Datum of gage is 1,294.68 ft above NGVD of 1929 and 1,293.75 ft above NAVD of 1988. Prior to October 1996, at site 100 ft upstream at datum 1.55 ft higher.
REMARKS.--Water Years 2014-17: Records good except those for estimated daily discharges, which are poor. Water Years 2018-24: Records fair except those for estimated daily discharges, which are poor.
EXTREMES FOR PERIOD OF RECORD.--Maximum discharge, 5,690 ft³/s, Jan. 19, 1996, gage height, 9.60 ft, from floodmark, present site and datum (11.20 ft, from floodmark in gage well, site and datum then in use), from rating curve extended above 1,300 ft³/s on basis of contracted-opening measurement of peak flow; minimum discharge, 0.60 ft³/s, Sept. 10, 1997; minimum gage height, 1.83 ft, July 13, 2008.
 WaterAlert – get an
email or text (SMS) alert based on your chosen threshold.
WaterAlert – get an
email or text (SMS) alert based on your chosen threshold.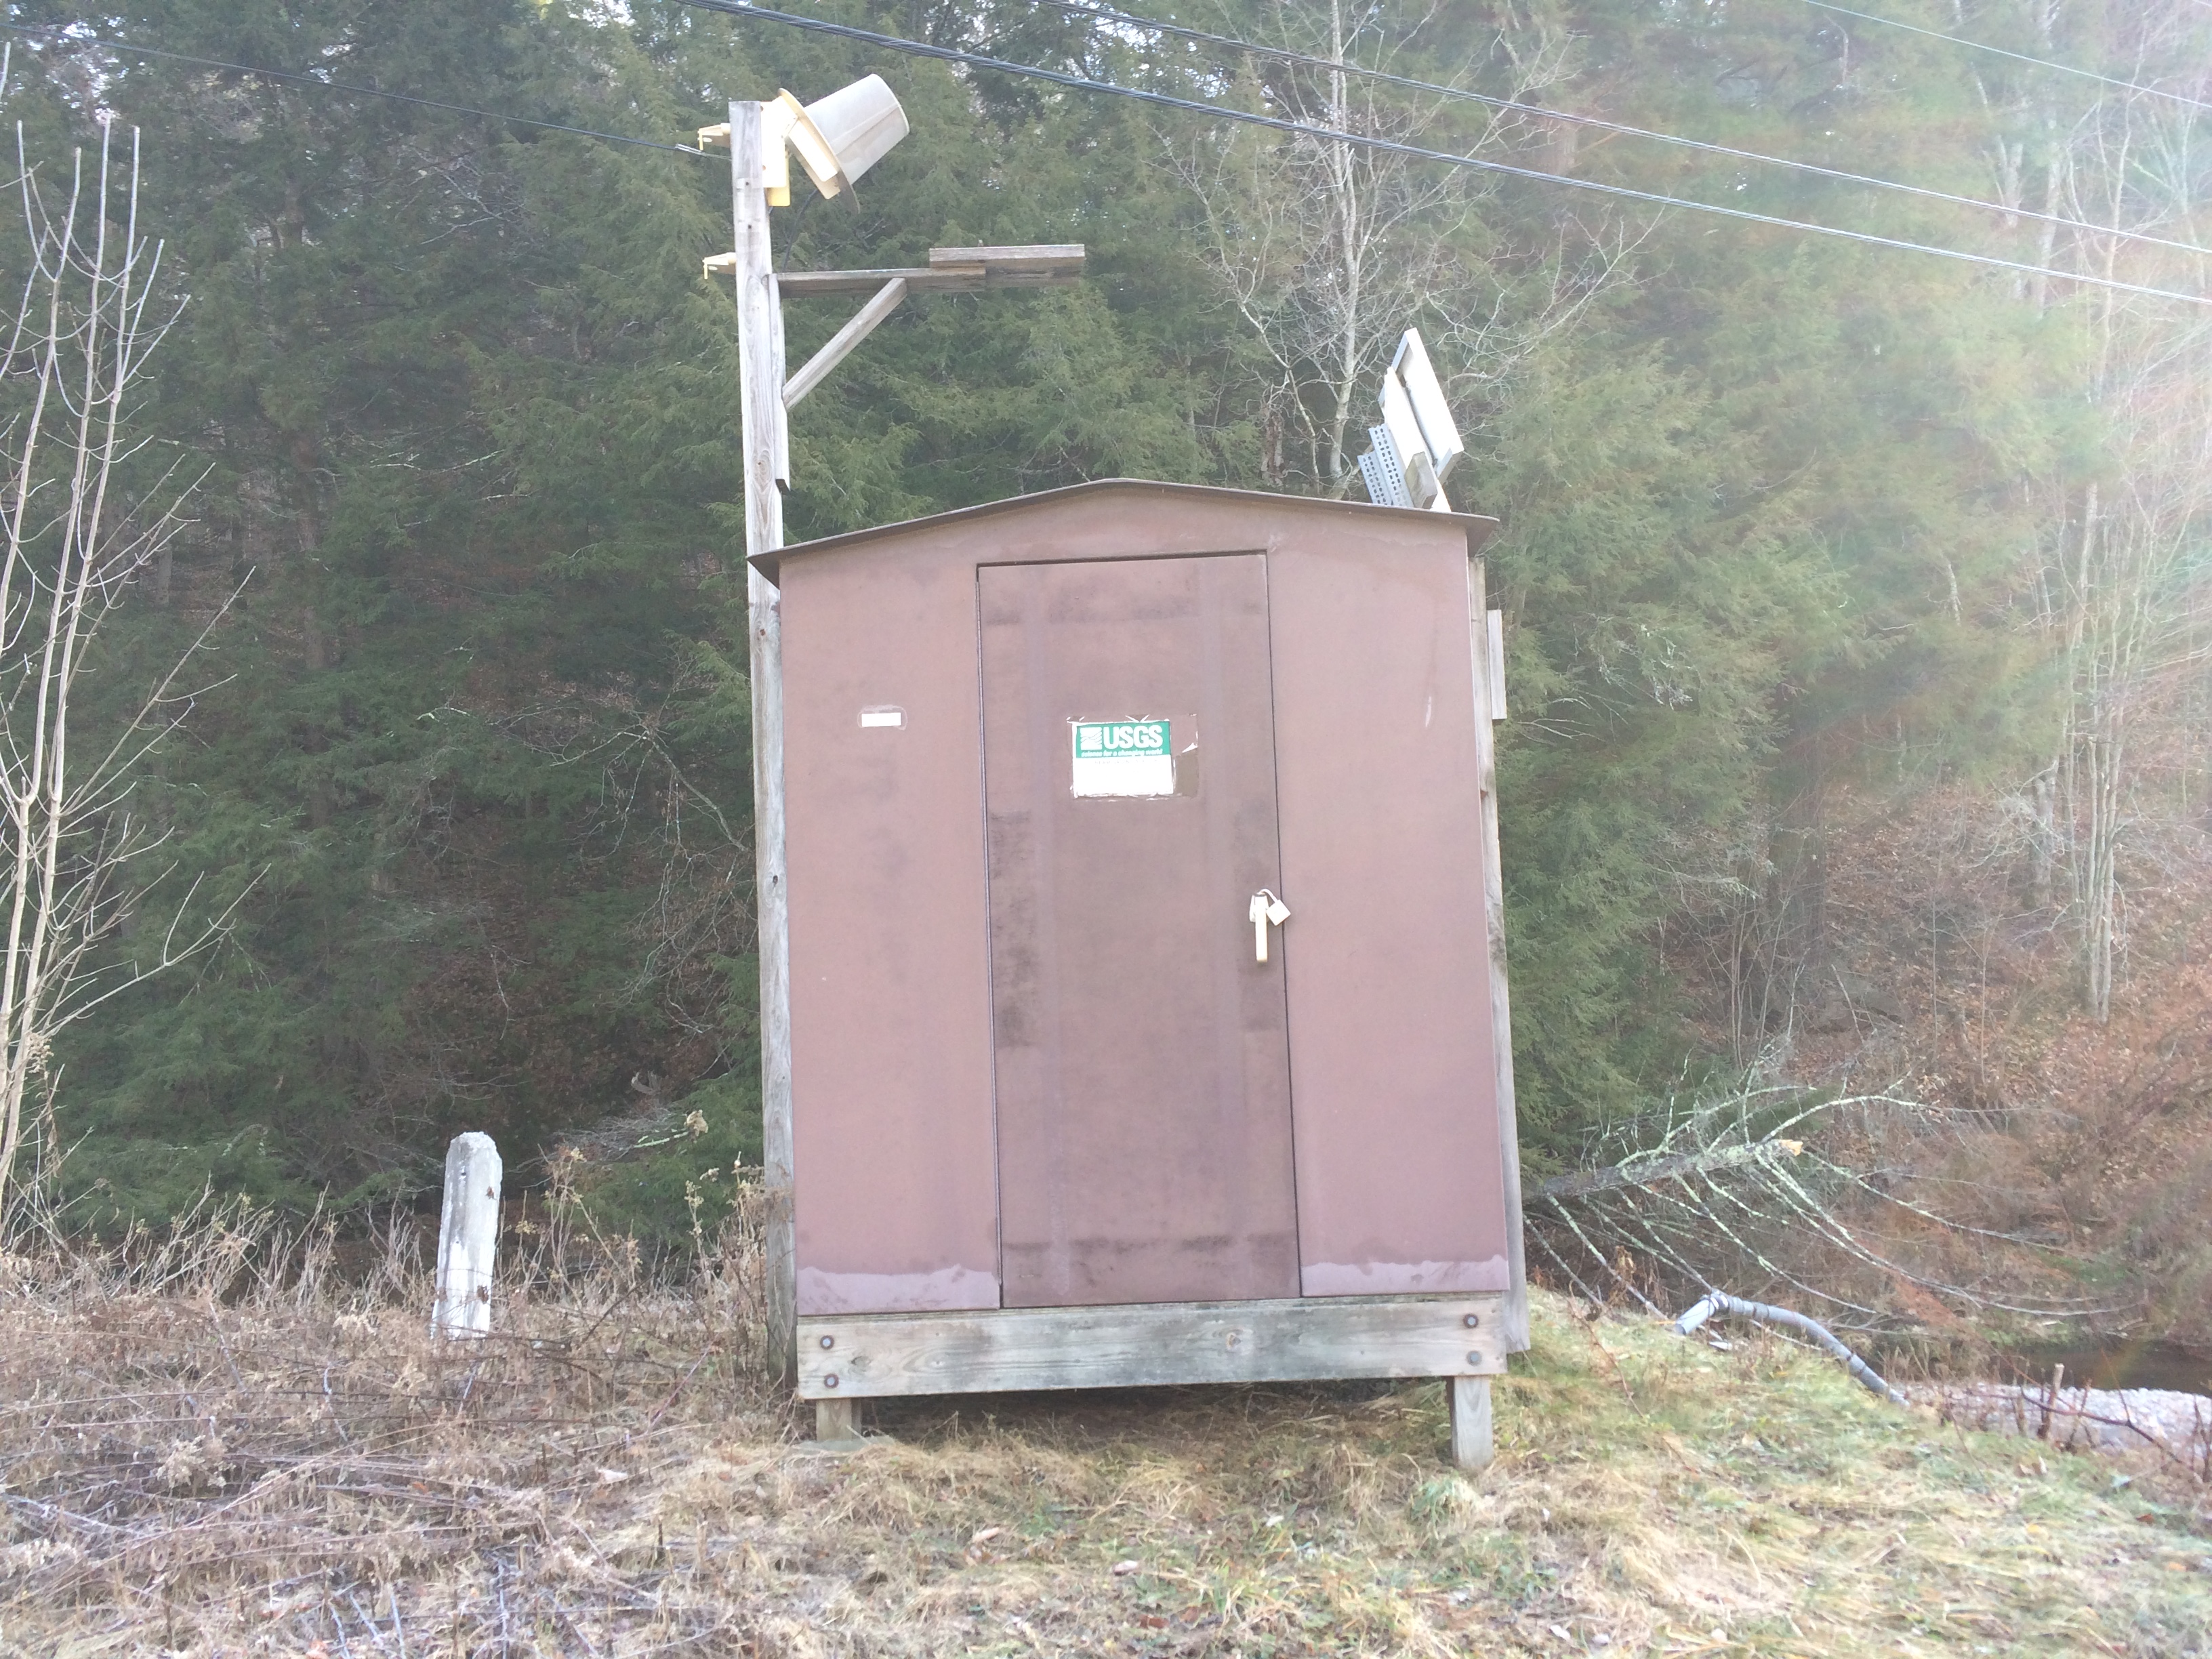 Station image
Summary of all available data for this site
Instantaneous-data availability statement

