PROVISIONAL DATA SUBJECT TO REVISION
Click to hidestation-specific text
Funding for this site is provided by:
 Site Information
LOCATION.--Lat 41°30'31.5", long
74°59'09.8" referenced to North American Datum of
1983, Sullivan County, NY, Hydrologic Unit 02040101, on left
bank 1.6 mi upstream from Lackawaxen River, and 4.6 mi
northwest of Barryville.
DRAINAGE AREA.--2,020 mi².
PERIOD OF RECORD.--October 1940 to current year.
REVISIONS HISTORY.--WDR NY-82-1: Drainage area. WDR NY-04-1: 2003.
GAGE.--Water-stage recorder and crest-stage gage. Datum of gage is 600.22 ft above NGVD of 1929 and 599.51 ft above NAVD of 1988.
REMARKS.--Subsequent to September 1954, entire flow from 371 mi² of drainage area controlled by Pepacton Reservoir (station 01416900), and subsequent to October 1963, entire flow from 454 mi² of drainage area controlled by Cannonsville Reservoir (station 01424997). Part of flow of these reservoirs diverted for New York City municipal supply. Remainder of flow (except for conservation releases and spill) impounded for release during periods of low flow in the lower Delaware River basin, as directed by the Delaware River Master.
Water Years 2014-24: Records good except those for estimated daily discharges, which are poor.
EXTREMES FOR PERIOD OF RECORD.--Maximum discharge prior to current degree of regulation, 130,000 ft³/s, Aug. 19, 1955, gage height, 26.40 ft, from floodmarks in gage house, from rating curve extended above 57,000 ft³/s on basis of slope-area measurement at gage height 23.19 ft; maximum discharge since current degree of regulation, 151,000 ft³/s, June 28, 2006, gage height, 28.97 ft, from floodmark in gage house, from rating curve extended as explained above; minimum discharge, 122 ft³/s, Sept. 5, 1953, gage height, 1.11 ft.
PERIOD OF DAILY RECORD1.--WATER TEMPERATURE: October 1967 to current year (no winter record for water years 1969-76).
INSTRUMENTATION1.--Water-temperature satellite and telephone telemeter provides 15-minute-interval readings. From October 1975 to September 1995, water-temperature recorder provided one-hour-interval readings. Prior to October 1975, water-temperature recorder provided continuous readings.
REMARKS1.--Temperature readings prior to Oct. 1, 2007, rounded to the nearest 0.5 °C.
EXTREMES FOR PERIOD OF DAILY RECORD1.--WATER TEMPERATURE: Prior to Oct. 1, 2007--Maximum (water years 1968-75, 1980-81, 1983, 1985-96, 1998-2001, 2003-07), 32.5 °C, July 9, 10, 1993; minimum (water years 1968, 1977-2007), 0.0 °C, on many days during winter periods, each year except water years 1980-82. WATER TEMPERATURE: After Oct. 1, 2007--Maximum, 33.5 °C, July 27, 29, 2020; minimum (water years 2008, 2010-current), -0.2 °C, on several days during 2022 winter period.
1 Water-Quality Records
 WaterAlert – get an
email or text (SMS) alert based on your chosen threshold.
WaterAlert – get an
email or text (SMS) alert based on your chosen threshold.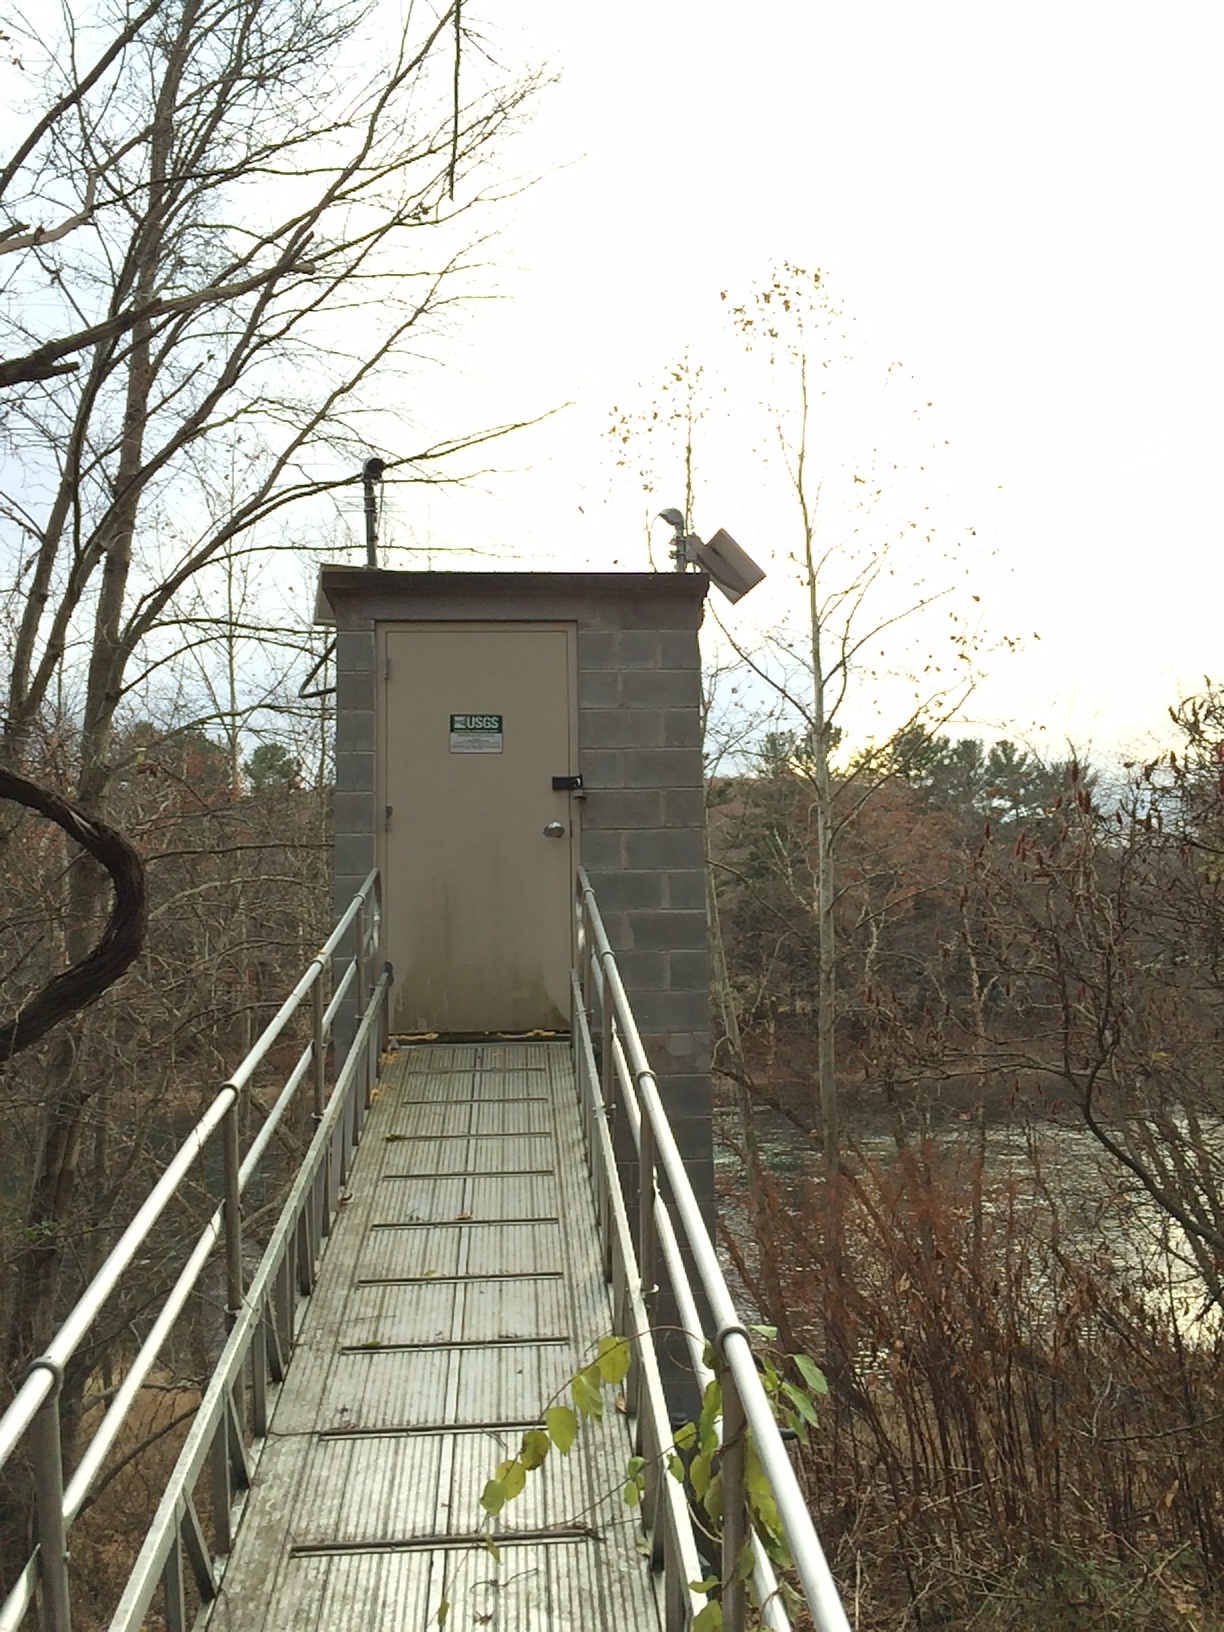 Station image
Summary of all available data for this site
Instantaneous-data availability statement


