PROVISIONAL DATA SUBJECT TO REVISION
Click to hidestation-specific text
Funding for this site is provided by:
 STATION.--01472810 EAST BRANCH PERKIOMEN CREEK NEAR
SCHWENKSVILLE, PA
STATION.--01472810 EAST BRANCH PERKIOMEN CREEK NEAR
SCHWENKSVILLE, PALOCATION.--Lat 40`15'31", long 75`25'45", Montgomery County, Hydrologic Unit 02040203, on left bank 600 ft upstream from Bergey's Mill bridge, and 2.0 mi east of Schwenksville.
DRAINAGE AREA.--58.7 square miles, not including distributary.
PERIOD OF RECORD.--January 1991 to current year.
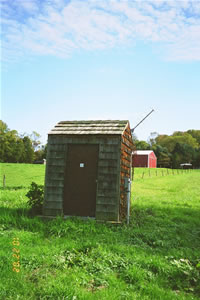
GAGE.--Water-stage recorder and crest-stage gage. Elevation of gage is 150 ft above National Geodetic Vertical Datum of 1929, from topographic map. Satellite telemetry at station.
COOPERATION.--Funding for the operation of this station is provided by the Delaware River Basin Commission.
REMARKS.--Stream has received pumpage from Bradshaw Reservoir since August 1989. Peak flows are unregulated. Irrigation pond for the county golf course 300 ft upstream also occasionally draw water from the creek.
GAGE HEIGHTS OF IMPORTANCE.- Maximum recordable gage height (operational limit) - 15.9 ft.
Supplied by NWS:--Action stage-7 ft; Flood stage-8 ft; Moderate flood stage-10 ft; Major flood stage-12 ft.
Summary of all available data for this site
Instantaneous-data availability statement

