USGS 01473169 Valley Creek at PA Turnpike Br near Valley Forge

PROVISIONAL DATA SUBJECT TO REVISION

Click to hidestation-specific text


Station gage image
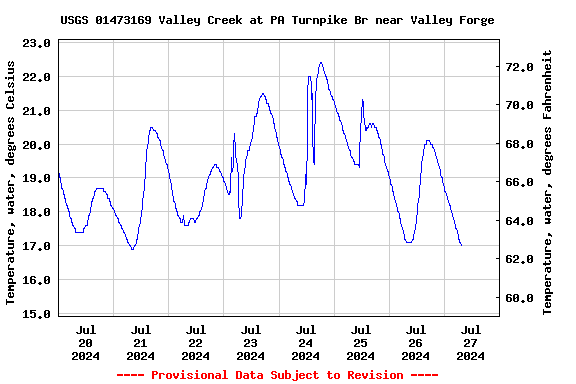
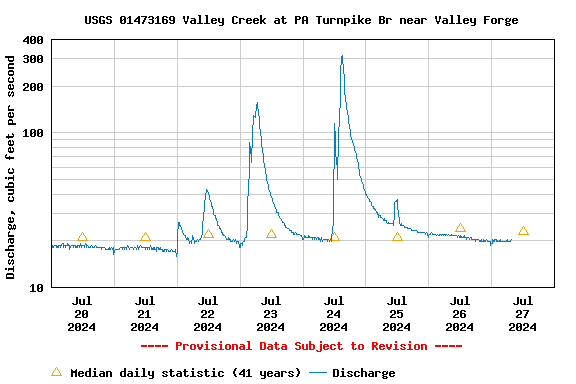
STATION.--01473169 VALLEY CREEK AT PENNSYLVANIA TURNPIKE BRIDGE NEAR VALLEY FORGE, PA
LOCATION.--Lat 40`04'45", long 75`27'40", Chester County, Hydrologic Unit 02040203, on right bank 100 ft upstream from Pennsylvania turnpike bridge, 0.9 mi downstream from Little Valley Creek, and near Valley Forge.
DRAINAGE AREA.--20.8 square miles.
PERIOD OF RECORD.--October 1982 to current year.
GAGE.--Water-stage recorder, water-quality monitor and Pluvio precipitation gage. Satellite telemetry at station. Datum of gage is 108.62 ft above National Geodetic Vertical Datum of 1929.
COOPERATION.--Funding for the operation of this station provided by Chester County Water Resources Authority, the U.S. National Park Service, and the U.S. Geological Survey.
REMARKS.--Intermittent pumpage from quarry upstream.
GAGE HEIGHTS OF IMPORTANCE.-
Supplied by USGS: Maximum recordable gage height (stage sensor operational limit) - 24.2 ft; Data transmitter operational limit - 24.8 ft;
Supplied by NWS: No flood stage has been determined for this station.
This station managed by the PAWSC Downingtown Field Office.

Available Parameters Available Period
  
2018-10-01  2024-07-27
2009-10-01  2024-07-27
1990-10-31  2024-07-27
2007-10-01  2024-07-27
2018-10-01  2024-07-27
2007-10-01  2024-07-27
2021-07-27  2024-07-27
2021-07-27  2024-07-27
2021-07-27  2024-07-27
2007-10-01  2024-07-27
2007-10-01  2024-07-27


 (7)
 

  -- or --


Summary of all available data for this site
Instantaneous-data availability statement


Temperature, water, degrees Celsius

Most recent instantaneous value: 17.4 07-27-2024   05:30 EDT
Graph of

Add up to 2 more sites and replot for "Temperature, water, degrees Celsius"

?


Create presentation-quality / stand-alone graph.   Subscribe to WaterAlert      

See this graph on the Monitoring Location Pages


Precipitation, total, inches

Most recent instantaneous value: 0.00 07-27-2024   05:30 EDT
Graph of  Precipitation, total, inches

Add up to 2 more sites and replot for "Precipitation, total, inches"

?


Create presentation-quality / stand-alone graph.   Subscribe to WaterAlert      

See this graph on the Monitoring Location Pages


Discharge, cubic feet per second

Most recent instantaneous value: 19.7 07-27-2024   05:30 EDT
Graph of

Add up to 2 more sites and replot for "Discharge, cubic feet per second"

?


Create presentation-quality / stand-alone graph.   Subscribe to WaterAlert      

See this graph on the Monitoring Location Pages


Daily discharge, cubic feet per second -- statistics for Jul 27 based on 41 water years of record more
Min
(2002)
25th
percen-
tile
Most Recent
Instantaneous
Value Jul 27
Median 75th
percen-
tile
Mean Max
(1986)
9.89 19 19.7 23 32 34 158


Gage height, feet

Most recent instantaneous value: 3.23 07-27-2024   05:30 EDT
Graph of

Add up to 2 more sites and replot for "Gage height, feet"

?


Create presentation-quality / stand-alone graph.   Subscribe to WaterAlert      

See this graph on the Monitoring Location Pages


Specific conductance, water, unfiltered, microsiemens per centimeter at 25 degrees Celsius

Most recent instantaneous value: 743 07-27-2024   05:30 EDT
Graph of  Specific conductance, water, unfiltered, microsiemens per centimeter at 25 degrees Celsius

Add up to 2 more sites and replot for "Specific conductance, water, unfiltered, microsiemens per centimeter at 25 degrees Celsius"

?


Create presentation-quality / stand-alone graph.   Subscribe to WaterAlert      

See this graph on the Monitoring Location Pages


Turbidity, water, unfiltered, monochrome near infra-red LED light, 780-900 nm, detection angle 90 +-2.5 degrees, formazin nephelometric units (FNU)

Most recent instantaneous value: 7.1 07-27-2024   05:30 EDT
Graph of  Turbidity, water, unfiltered, monochrome near infra-red LED light, 780-900 nm, detection angle 90 +-2.5 degrees, formazin nephelometric units (FNU)

Add up to 2 more sites and replot for "Turbidity, water, unfiltered, monochrome near infra-red LED light, 780-900 nm, detection angle 90 +-2.5 degrees, formazin nephelometric units (FNU)"

?


Create presentation-quality / stand-alone graph.   Subscribe to WaterAlert      

See this graph on the Monitoring Location Pages


Chloride, water, unfiltered, computed by regression equation, milligrams per liter

Most recent instantaneous value: 108 07-27-2024   05:30 EDT
Graph of  Chloride, water, unfiltered, computed by regression equation, milligrams per liter

Add up to 2 more sites and replot for "Chloride, water, unfiltered, computed by regression equation, milligrams per liter"

?


Create presentation-quality / stand-alone graph.   Subscribe to WaterAlert      

See this graph on the Monitoring Location Pages


Chloride flux, water, unfiltered, computed by regression equation, pounds per day

Most recent instantaneous value: 11500 07-27-2024   05:30 EDT
Graph of  Chloride flux, water, unfiltered, computed by regression equation, pounds per day

Add up to 2 more sites and replot for "Chloride flux, water, unfiltered, computed by regression equation, pounds per day"

?


Create presentation-quality / stand-alone graph.   Subscribe to WaterAlert      

See this graph on the Monitoring Location Pages


Chloride yield, water, unfiltered, computed by regression equation, pounds per day per square mile

Most recent instantaneous value: 552 07-27-2024   05:30 EDT
Graph of  Chloride yield, water, unfiltered, computed by regression equation, pounds per day per square mile

Add up to 2 more sites and replot for "Chloride yield, water, unfiltered, computed by regression equation, pounds per day per square mile"

?


Create presentation-quality / stand-alone graph.   Subscribe to WaterAlert      

See this graph on the Monitoring Location Pages


Suspended sediment load, water, unfiltered, computed, the product of regression-computed suspended sediment concentration and streamflow, short tons per day

Most recent instantaneous value: 0.721 07-27-2024   05:30 EDT
Graph of  Suspended sediment load, water, unfiltered, computed, the product of regression-computed suspended sediment concentration and streamflow, short tons per day

Add up to 2 more sites and replot for "Suspended sediment load, water, unfiltered, computed, the product of regression-computed suspended sediment concentration and streamflow, short tons per day"

?


Create presentation-quality / stand-alone graph.   Subscribe to WaterAlert      

See this graph on the Monitoring Location Pages


Suspended sediment concentration, water, unfiltered, estimated by regression equation, milligrams per liter

Most recent instantaneous value: 13.5 07-27-2024   05:30 EDT
Graph of  Suspended sediment concentration, water, unfiltered, estimated by regression equation, milligrams per liter

Add up to 2 more sites and replot for "Suspended sediment concentration, water, unfiltered, estimated by regression equation, milligrams per liter"

?


Create presentation-quality / stand-alone graph.   Subscribe to WaterAlert      

See this graph on the Monitoring Location Pages