Warning: Javascript must be enabled to use all the features on this page!


Page Loading - Please Wait...

Click to hideNews Bulletins
! This page is undergoing modernization with expected decommissioning as key features are added to the modernized pages.
Learn more about our modernization plans to find out which options will suit you best. Next Generation Monitoring Location Page is available now.

USGS 01475530 Cobbs Cr at U.S. Hghwy No. 1 at Philadelphia, PA

PROVISIONAL DATA SUBJECT TO REVISION

Click to hidestation-specific text


Station gage imageSTATION.--01475530 
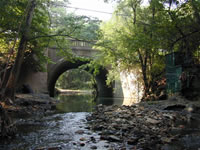
COBBS CR AT U.S. HIGHWAY 1 AT PHILADELPHIA, PA
LOCATION.--Lat 39`58'29", long 75`16'49", Philadelphia County, Hydrologic Unit 02040202, on left bank 30 ft downstream from bridge on U.S. Highway No. 1 and 50 ft upstream from unnamed tributary at west city limits of Philadelphia.
DRAINAGE AREA.--4.78 square miles.
PERIOD OF RECORD.--October 1964 to September 1981, September 2004 to current year.
GAGE.--Water-stage recorder, water-quality monitor, concrete control and crest-stage gage. Datum of gage is 121.76 ft above National Geodetic Vertical Datum of 1929. Satellite telemetry at station.
COOPERATION.--Station established and maintained by the U.S. Geological Survey. Funding for the operation of this station is provided by the U.S. Geological Survey and the City of Philadelphia Water Department.
REMARKS.-- Calibration of water-quality instrumentation is conducted exclusively by Philadelphia Water Department personnel with USGS oversight. Erroneous or missing data, resulting from instrument malfunction, are not the responsibility of USGS.
This station managed by the PAWSC Downingtown Field Office.

Available Parameters Available Period
  
2018-10-01  2024-04-19
2005-10-01  2024-04-19
2007-10-01  2024-04-19
2018-10-01  2024-04-19
2018-10-01  2024-04-19
2018-10-01  2024-04-19
2018-10-01  2024-04-19


 (7)
 

  -- or --


Summary of all available data for this site
Instantaneous-data availability statement


Temperature, water, degrees Celsius

Most recent instantaneous value: 13.2 04-19-2024   19:30 EDT
Graph of

Add up to 2 more sites and replot for "Temperature, water, degrees Celsius"

?


Create presentation-quality / stand-alone graph.   Subscribe to WaterAlert      

See this graph on the Monitoring Location Pages


Discharge, cubic feet per second

Most recent instantaneous value: 6.50 04-19-2024   19:30 EDT
Graph of

Add up to 2 more sites and replot for "Discharge, cubic feet per second"

?


Create presentation-quality / stand-alone graph.   Subscribe to WaterAlert      

See this graph on the Monitoring Location Pages


Daily discharge, cubic feet per second -- statistics for Apr 19 based on 36 water years of record more
Min
(2023)
25th
percen-
tile
Median Most Recent
Instantaneous
Value Apr 19
Mean 75th
percen-
tile
Max
(2022)
2.47 4 5.5 6.50 6.5 7.8 28.5


Gage height, feet

Most recent instantaneous value: 2.62 04-19-2024   19:30 EDT
Graph of

Add up to 2 more sites and replot for "Gage height, feet"

?


Create presentation-quality / stand-alone graph.   Subscribe to WaterAlert      

See this graph on the Monitoring Location Pages


Specific conductance, water, unfiltered, microsiemens per centimeter at 25 degrees Celsius

Most recent instantaneous value: 566 04-19-2024   19:30 EDT
Graph of

Add up to 2 more sites and replot for "Specific conductance, water, unfiltered, microsiemens per centimeter at 25 degrees Celsius"

?


Create presentation-quality / stand-alone graph.   Subscribe to WaterAlert      

See this graph on the Monitoring Location Pages


Dissolved oxygen, water, unfiltered, milligrams per liter

Most recent instantaneous value: 10.2 04-19-2024   19:30 EDT
Graph of

Add up to 2 more sites and replot for "Dissolved oxygen, water, unfiltered, milligrams per liter"

?


Create presentation-quality / stand-alone graph.   Subscribe to WaterAlert      

See this graph on the Monitoring Location Pages


Dissolved oxygen, water, unfiltered, percent of saturation

Most recent instantaneous value: 97 04-19-2024   19:30 EDT
Graph of

Add up to 2 more sites and replot for "Dissolved oxygen, water, unfiltered, percent of saturation"

?


Create presentation-quality / stand-alone graph.   Subscribe to WaterAlert      

See this graph on the Monitoring Location Pages


pH, water, unfiltered, field, standard units

Most recent instantaneous value: 7.6 04-19-2024   19:30 EDT
Graph of

Add up to 2 more sites and replot for "pH, water, unfiltered, field, standard units"

?


Create presentation-quality / stand-alone graph.   Subscribe to WaterAlert      

See this graph on the Monitoring Location Pages