LOCATION.--Lat 42°01'43", long
77°07'56" referenced to North American Datum of 1983,
Steuben County, NY, Hydrologic Unit 02050104, on left bank 50
ft downstream from bridge on County Highway 120 at Lindley, and
6 mi upstream from Canisteo River.
DRAINAGE AREA.--771 mi².
PERIOD OF RECORD.--January 1930 to March 1995, annual
maximum only--1997-2009, October 2009 to current year.
REVISIONS HISTORY.--WSP 871: 1938. WSP 2103: Drainage
area. WDR NY-04-3: 2002-03 (M).
GAGE.--Water-stage recorder. Datum of gage is 964.50 ft
above NGVD of 1929 and 963.91 ft above NAVD of 1988.
REMARKS.--Since November 1979, flood flows regulated by
Tioga Lake (station 01517900) and Hammond Lake (station
01518498), and since December 1979, by Cowanesque Lake (station
01519995); normal regulation occasionally sufficient to affect
figures of monthly runoff.
Water Years 2014-23: Records good except those for estimated
daily discharges, which are poor.
EXTREMES FOR PERIOD OF RECORD.--Maximum discharge since
construction of Tioga, Hammond, and Cowanesque Lakes in 1979,
13,900 ft³/s, Oct. 23, 1990, Aug. 18, 1994, and Sept. 17, 2004;
maximum gage height, 13.81 ft, Sept. 17, 2004; minimum
discharge, 21 ft³/s, Aug. 28, 1980, gage height, 2.68 ft.
EXTREMES FOR PERIOD PRIOR TO REGULATION.--Maximum
discharge prior to construction of Tioga, Hammond, and
Cowanesque Lakes in 1979, 128,000 ft³/s, June 23, 1972, gage
height, 26.27 ft, from floodmark in gage house, from rating
curve extended above 31,000 ft³/s on basis of velocity-area and
slope-area studies at gage height 19.2 ft and conveyance study
and slope-area measurements at gage heights 22.87 ft and 26.27
ft; minimum discharge, 6.1 ft³/s, Sept. 1, 1939.

 Site Information
 WaterAlert – get an
email or text (SMS) alert based on your chosen threshold.
WaterAlert – get an
email or text (SMS) alert based on your chosen threshold.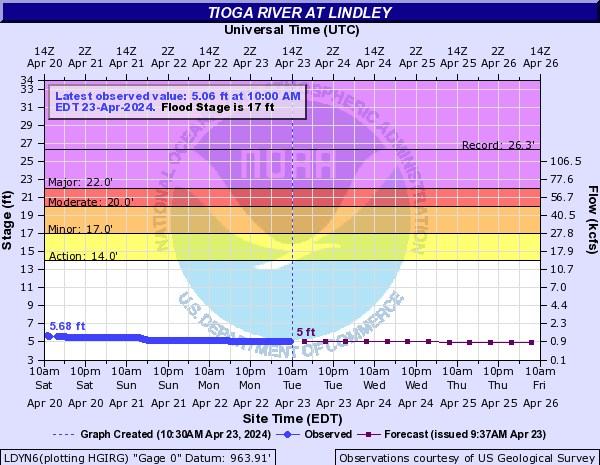
 Station image
