Warning: Javascript must be enabled to use all the features on this page!


Page Loading - Please Wait...

Click to hideNews Bulletins
! This page is undergoing modernization with expected decommissioning as key features are added to the modernized pages.
Learn more about our modernization plans to find out which options will suit you best. Next Generation Monitoring Location Page is available now.

USGS 01543000 Driftwood Br Sinnemahoning Cr at Sterling Run, PA

PROVISIONAL DATA SUBJECT TO REVISION

Click to hidestation-specific text


Station gage imageSTATION.--
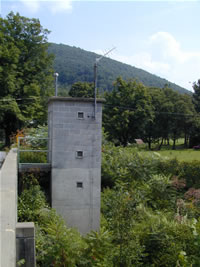
01543000 DRIFTWOOD BRANCH SINNEMAHONING CREEK AT STERLING RUN, PA
LOCATION.--Lat 41`24'48", long 78`11'50", Cameron County, Hydrologic Unit 02050202, on left bank at downstream side of highway bridge on SR 3002 at village of Sterling Run, and 300 ft upstream from Sterling Run.
DRAINAGE AREA.--272 square miles.
PERIOD OF RECORD.--October 1913 to current year.
GAGE.--Water-stage recorder. Datum of gage is 894.84 ft above National Geodetic Vertical Datum of 1929. Oct. 1, 1913 to Sept. 30, 1931: non-recording gage; Oct. 1, 1931 to Sept. 30, 1932 and Oct. 1, 1942 to Oct. 3, 1991: water-stage recorder at site 50 feet upstream on steel-truss bridge at same datum. Satellite and landline telemetry at station.
COOPERATION.--Station established and maintained by the U.S. Geological Survey. Funding for the operation of this station is provided by the Pennsylvania Department of Environmental Protection and the U.S. Geological Survey.
GAGE HEIGHTS OF IMPORTANCE.-
Supplied by USGS: Maximum recordable gage height (stage sensor operational limit) - 20.6 ft; Data transmitter operational limit - 22.0 ft;
Supplied by NWS: No flood stage has been determined for this station.
This station managed by the PAWSC Williamsport Field Office.

Available Parameters Available Period
  
1990-10-01  2024-04-23
2007-10-01  2024-04-23


 (7)
 

  -- or --


Summary of all available data for this site
Instantaneous-data availability statement


Discharge, cubic feet per second

Most recent instantaneous value: 452 04-23-2024   18:45 EDT
Graph of  Discharge, cubic feet per second

Add up to 2 more sites and replot for "Discharge, cubic feet per second"

?


Create presentation-quality / stand-alone graph.   Subscribe to WaterAlert      

See this graph on the Monitoring Location Pages


Daily discharge, cubic feet per second -- statistics for Apr 23 based on 110 water years of record more
Min
(2010)
25th
percen-
tile
Most Recent
Instantaneous
Value Apr 23
Median Mean 75th
percen-
tile
Max
(1916)
135 303 452 481 660 791 3030


Gage height, feet

Most recent instantaneous value: 0.12 04-23-2024   18:45 EDT
Graph of  Gage height, feet

Add up to 2 more sites and replot for "Gage height, feet"

?


Create presentation-quality / stand-alone graph.   Subscribe to WaterAlert      

See this graph on the Monitoring Location Pages