Warning: Javascript must be enabled to use all the features on this page!


Page Loading - Please Wait...

Click to hideNews Bulletins
! This page is undergoing modernization with expected decommissioning as key features are added to the modernized pages.
Learn more about our modernization plans to find out which options will suit you best. Next Generation Monitoring Location Page is available now.

USGS 01547950 Beech Creek at Monument, PA

PROVISIONAL DATA SUBJECT TO REVISION

Click to hidestation-specific text


Station gage imageSTATION.--
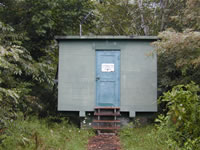
01547950 BEECH CREEK AT MONUMENT, PA
LOCATION.--Lat 41`06'42", long 77`42'09", Centre County, Hydrologic Unit 02050204, on right bank 800 ft downstream from bridge at Monument, 850 ft downstream from Monument Run, 0.6 mi upstream from Twin Run, and 8.7 mi upstream from mouth.
DRAINAGE AREA.--152 square miles.
PERIOD OF RECORD.--October 1968 to current year.
GAGE.--Water-stage recorder and crest-stage gage. Datum of gage is 741.04 ft above North American Vertical Datum of 1988. Prior to September 1, 2023, the datum of gage was reported as 741.60 ft above National Geodetic Vertical Datum of 1929. Satellite telemetry at station.
COOPERATION.--Funding for this station is provided by the Pennsylvania Department of Environmental Protection and the U.S. Geological Survey.
GAGE HEIGHTS OF IMPORTANCE.-
Supplied by USGS: Maximum recordable gage height (stage sensor operational limit) - 22.0 ft; Data transmitter operational limit - 23.4 ft;
Supplied by NWS: No flood stage has been determined for this station.
This station managed by the PAWSC Williamsport Field Office.

Available Parameters Available Period
  
1990-10-01  2024-04-24
2007-10-01  2024-04-24
2021-01-01  2024-04-24


 (7)
 

  -- or --


Summary of all available data for this site
Instantaneous-data availability statement


Discharge, cubic feet per second

Most recent instantaneous value: 340 04-24-2024   15:45 EDT
Graph of  Discharge, cubic feet per second

Add up to 2 more sites and replot for "Discharge, cubic feet per second"

?


Create presentation-quality / stand-alone graph.   Subscribe to WaterAlert      

See this graph on the Monitoring Location Pages


Daily discharge, cubic feet per second -- statistics for Apr 24 based on 55 water years of record more
Min
(2010)
25th
percen-
tile
Median Most Recent
Instantaneous
Value Apr 24
Mean 75th
percen-
tile
Max
(1993)
111 192 308 340 371 426 1260


Gage height, feet

Most recent instantaneous value: 6.40 04-24-2024   15:45 EDT
Graph of  Gage height, feet

Add up to 2 more sites and replot for "Gage height, feet"

?


Create presentation-quality / stand-alone graph.   Subscribe to WaterAlert      

See this graph on the Monitoring Location Pages


Stream water level elevation above NAVD 1988, in feet

Most recent instantaneous value: 747.44 04-24-2024   15:45 EDT
Graph of  Stream water level elevation above NAVD 1988, in feet

Add up to 2 more sites and replot for "Stream water level elevation above NAVD 1988, in feet"

?


Create presentation-quality / stand-alone graph.   Subscribe to WaterAlert      

See this graph on the Monitoring Location Pages