Warning: Javascript must be enabled to use all the features on this page!


Page Loading - Please Wait...

Click to hideNews Bulletins
! This page is undergoing modernization with expected decommissioning as key features are added to the modernized pages.
Learn more about our modernization plans to find out which options will suit you best. Next Generation Monitoring Location Page is available now.

USGS 01553700 Chillisquaque Creek at Washingtonville, PA

PROVISIONAL DATA SUBJECT TO REVISION

Click to hidestation-specific text


Station gage imageSTATION.--
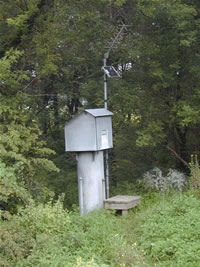
01553700 CHILLISQUAQUE CREEK AT WASHINGTONVILLE, PA
LOCATION.--Lat 41`03'42", long 76`40'50", Montour County, Hydrologic Unit 02050206, on left bank 60 ft upstream from bridge on State Highway 54, and 0.7 mi north of U.S. Post Office in Washingtonville.
DRAINAGE AREA.--5l.3 square miles.
PERIOD OF RECORD.--May 1979 to current year.
GAGE.--Water-stage recorder. Datum of gage is 503.70 ft above National Geodetic Vertical Datum of 1929 (Pennsylvania Power and Light Co. bench mark). Satellite telemetry at station.
COOPERATION.--Funding for the operation of this station is provided by the Pennsylvania Department of Environmental Protection.
GAGE HEIGHTS OF IMPORTANCE.-
Supplied by USGS: Maximum recordable gage height (stage sensor operational limit) - 16.4 ft; Data transmitter operational limit - 17.8 ft;
Supplied by NWS: No flood stage has been determined for this station.
This station managed by the PAWSC Williamsport Field Office.

Available Parameters Available Period
  
1990-10-01  2024-04-19
2007-10-01  2024-04-19


 (7)
 

  -- or --


Summary of all available data for this site
Instantaneous-data availability statement


Discharge, cubic feet per second

Most recent instantaneous value: 47.8 04-19-2024   19:30 EDT
Graph of

Add up to 2 more sites and replot for "Discharge, cubic feet per second"

?


Create presentation-quality / stand-alone graph.   Subscribe to WaterAlert      

See this graph on the Monitoring Location Pages


Daily discharge, cubic feet per second -- statistics for Apr 19 based on 44 water years of record more
Min
(2023)
25th
percen-
tile
Most Recent
Instantaneous
Value Apr 19
Median Mean 75th
percen-
tile
Max
(2022)
13.2 33 47.8 56 84 105 343


Gage height, feet

Most recent instantaneous value: 1.11 04-19-2024   19:30 EDT
Graph of

Add up to 2 more sites and replot for "Gage height, feet"

?


Create presentation-quality / stand-alone graph.   Subscribe to WaterAlert      

See this graph on the Monitoring Location Pages