Warning: Javascript must be enabled to use all the features on this page!


Page Loading - Please Wait...

Click to hideNews Bulletins
! This page is undergoing modernization with expected decommissioning as key features are added to the modernized pages.
Learn more about our modernization plans to find out which options will suit you best. Next Generation Monitoring Location Page is available now.

USGS 015765195 Big Spring Run near Mylin Corners, PA

PROVISIONAL DATA SUBJECT TO REVISION

Click to hidestation-specific text


Station gage imageSTATION.--
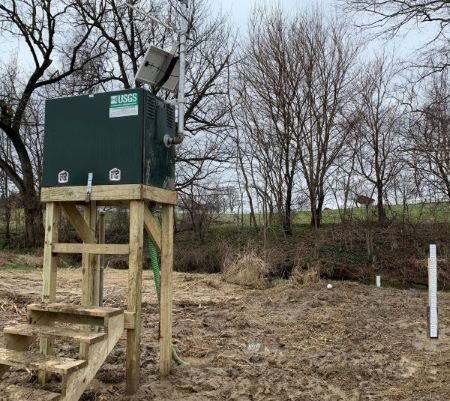
015765195 BIG SPRING RUN NEAR MYLIN CORNERS, PA
LOCATION.--Lat 39`59'45.37", long 76`15'50.54", Lancaster County, Hydrologic Unit 02050306, on right bank, 0.35 mile upstream of bridge on Long Riffle Road and 0.26 mile downstream from intersection of Beaver Valley Pike (Rt 741) and Gypsy Hill Road. September 24, 2008 to March 24, 2021, site was located 0.1 mi downstream.
DRAINAGE AREA.--1.68 square miles.
PERIOD OF RECORD.--October 2008 to current year.
GAGE.--Water-stage recorder, crest-stage gage, and water-quality recorder. Elevation of gage is 309 ft above North American Vertical Datum of 1988, from Lidar. September 24, 2008 to March 24, 2021, water-stage recorder, crest-stage gage, and water-quality recorder at site 550 ft downstream on right bank at datum 4 ft lower.
COOPERATION.--Station established and maintained by the U.S. Geological Survey in cooperation with Pennsylvania Department of Environmental Protection and Franklin and Marshall College.
REMARKS.--Satellite telemetry at station.
This station managed by the PAWSC New Cumberland Office.

Available Parameters Available Period
  
2012-11-16  2024-04-19
2008-10-15  2024-04-19
2008-10-14  2024-04-19
2016-04-13  2024-04-19
2016-04-13  2024-04-19


 (7)
 

  -- or --


Summary of all available data for this site
Instantaneous-data availability statement


Temperature, water, degrees Celsius

Most recent instantaneous value: 12.7 04-19-2024   18:00 EDT
Graph of

Add up to 2 more sites and replot for "Temperature, water, degrees Celsius"

?


Create presentation-quality / stand-alone graph.   Subscribe to WaterAlert      

See this graph on the Monitoring Location Pages


Discharge, cubic feet per second

Most recent instantaneous value: 2.82 04-19-2024   18:00 EDT
Graph of

Add up to 2 more sites and replot for "Discharge, cubic feet per second"

?


Create presentation-quality / stand-alone graph.   Subscribe to WaterAlert      

See this graph on the Monitoring Location Pages


Daily discharge, cubic feet per second -- statistics for Apr 19 based on 15 water years of record more
Min
(2023)
25th
percen-
tile
Median Most Recent
Instantaneous
Value Apr 19
Mean 75th
percen-
tile
Max
(2013)
1.48 2.1 2.5 2.82 3.5 4.3 9.85


Gage height, feet

Most recent instantaneous value: 3.86 04-19-2024   18:00 EDT
Graph of

Add up to 2 more sites and replot for "Gage height, feet"

?


Create presentation-quality / stand-alone graph.   Subscribe to WaterAlert      

See this graph on the Monitoring Location Pages


Specific conductance, water, unfiltered, microsiemens per centimeter at 25 degrees Celsius

Most recent instantaneous value: 784 04-19-2024   18:00 EDT
Graph of

Add up to 2 more sites and replot for "Specific conductance, water, unfiltered, microsiemens per centimeter at 25 degrees Celsius"

?


Create presentation-quality / stand-alone graph.   Subscribe to WaterAlert      

See this graph on the Monitoring Location Pages


Turbidity, water, unfiltered, monochrome near infra-red LED light, 780-900 nm, detection angle 90 +-2.5 degrees, formazin nephelometric units (FNU)

Most recent instantaneous value: 2.1 04-19-2024   18:00 EDT
Graph of

Add up to 2 more sites and replot for "Turbidity, water, unfiltered, monochrome near infra-red LED light, 780-900 nm, detection angle 90 +-2.5 degrees, formazin nephelometric units (FNU)"

?


Create presentation-quality / stand-alone graph.   Subscribe to WaterAlert      

See this graph on the Monitoring Location Pages