PROVISIONAL DATA SUBJECT TO REVISION
Click to hidestation-specific text
NOTICE (10/01/2023)--Water quality data collection at this streamgage has been discontinued. If there are questions concerning the operation of this site, please contact Chuck Walker (cwwalker@usgs.gov;443-498-5523).
 LOCATION.--Lat 39°19'04.7", long
76°33'18.5", Baltimore City, MD, Hydrologic Unit 02060003, on
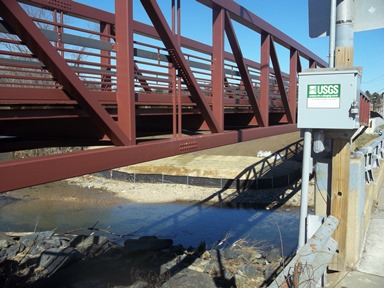
right upstream side of bridge on Sinclair Lane, and 4.4 mi upstream
from mouth.
LOCATION.--Lat 39°19'04.7", long
76°33'18.5", Baltimore City, MD, Hydrologic Unit 02060003, on
right upstream side of bridge on Sinclair Lane, and 4.4 mi upstream
from mouth.DRAINAGE AREA.--16.3 mi2, from automated delineation using 30-meter National Elevation Dataset, digital elevation model data, dated 2011.
PERIOD OF RECORD.--October 2013 to current year.
PERIOD OF WATER QUALITY RECORD.--October 2015 to current year.
REVISIONS HISTORY.--
https://waterdata.usgs.gov/nwis/dv/?site_no=01585219: 2019: Discharge.
https://waterdata.usgs.gov/nwis/dv/?site_no=01585219: 2021: Water Temperature.
https://waterdata.usgs.gov/nwis/dv/?site_no=01585219: 2021: Turbidity.
GAGE.--Water-stage recorder and crest-stage gage. Datum of gage is 31.25 ft above North American Vertical Datum of 1988.
REMARKS.--U.S. Geological Survey satellite data-collection platform at station.
EXTREMEMES FOR PERIOD OF RECORD.--Maximum discharge, 7,930 ft³/s, Feb. 24, 2016, gage height, 14.68 ft; minimum discharge, 1.0 ft³/s, Sept. 25, 2020, result of regulation from unknown source, upstream from station.
COOPERATION.--Funding for the operation of this station is provided by the Baltimore City Department of Public Works, and the U.S. Geological Survey.
Summary of all available data for this site
Instantaneous-data availability statement


