USGS 01585230 MOORES RUN AT RADECKE AVE AT BALTIMORE, MD

PROVISIONAL DATA SUBJECT TO REVISION

Click to hidestation-specific text
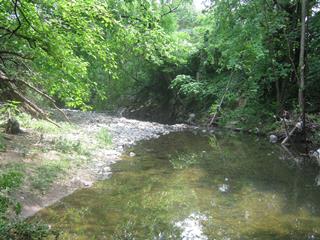
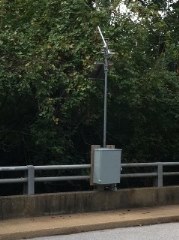
LOCATION.--Lat 39°19'48.3", long 76°32'05.6", Baltimore City, MD, Hydrologic Unit 02060003, on right
   downstream side of bridge on Radecke Avenue, at Baltimore, and 2.0 mi upstream from mouth.
DRAINAGE AREA.--3.52 mi2.
PERIOD OF RECORD.--July 1996 to October 2022.
REVISIONS HISTORY--WDR-US-2006: 1996-2005(P).
GAGE.--Water-stage recorder and crest-stage gage. Datum of gage is 39.41 ft above North American
   Vertical Datum of 1988.
REMARKS.--U.S. Geological Survey satellite data-collection platform at station. Water-quality
   records for some prior periods have been collected at this location.
EXTREMES FOR PERIOD OF RECORD.--Maximum discharge, 4,380 ft3/s, June 13, 2003,
   gage height, 10.48 ft; minimum discharge, 0.10 ft3/s, June 30, July 1-5, 2010.
Boating safety tips
This station managed by the MD-DE-DC Water Science Center Baltimore office.

Available Parameters Available Period
  
2015-10-02  2022-10-11
1996-07-23  2026-06-15
2007-10-01  2026-06-15
2015-10-02  2022-10-11


 (7)
 

  -- or --


Summary of all available data for this site
Instantaneous-data availability statement

Temperature, water, degrees Celsius, [Discontinued]
 
-- Data temporarily unavailable for the time period specified --


Discharge, cubic feet per second

Most recent instantaneous value: Rat 06-15-2026   11:17 EDT
Graph of  Discharge, cubic feet per second

Add up to 2 more sites and replot for "Discharge, cubic feet per second"

?


Create presentation-quality / stand-alone graph.   Subscribe to WaterAlert      

See this graph on the Monitoring Location Pages


Daily discharge, cubic feet per second -- statistics for Jun 15 based on 26 water years of record more
Most Recent
Instantaneous
Value Jun 15
Min
(2010)
25th
percen-
tile
Median Mean 75th
percen-
tile
Max
(2000)
-- unavailable -- 0.22 0.42 0.83 1.7 2.3 11.0


Gage height, feet

Most recent instantaneous value: 1.42 06-15-2026   11:17 EDT
Graph of  Gage height, feet

Add up to 2 more sites and replot for "Gage height, feet"

?


Create presentation-quality / stand-alone graph.   Subscribe to WaterAlert      

See this graph on the Monitoring Location Pages


pH, water, unfiltered, field, standard units, [Discontinued]
 
-- Data temporarily unavailable for the time period specified --