USGS 0214642825 BRIAR CREEK NEAR CHARLOTTE, NC

PROVISIONAL DATA SUBJECT TO REVISION

Click to hidestation-specific text
Mecklenburg County Logo 
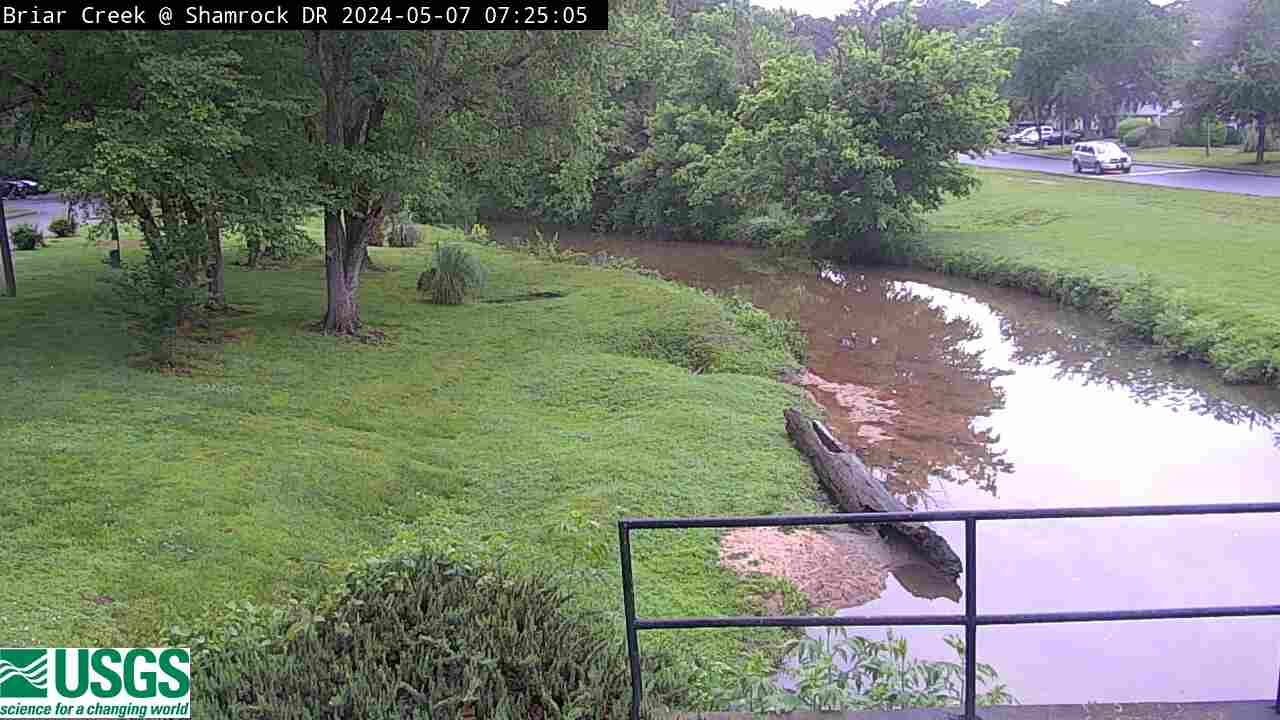
This station is operated in cooperation with Mecklenburg County, North Carolina.

Click on static image to see the Camera Summary Page for more details or options.

Time-lapse video products are considered a proof of concept with no guarantee regarding product up time. Time-lapse videos can be viewed using Chrome, Firefox or Opera browser application on smartphone, tablet, desktop and laptop devices. Additional browser support for Safari and Internet Explorer may be added later.

Any use of trade, firm, or product names is for descriptive purposes only and does not imply endorsement by the U.S. Government.

This station managed by the South Atlantic WSC Charlotte Field Office.

Available Parameters Available Period
  
1998-04-09  2024-03-19
2007-10-01  2024-03-19
2021-03-19  2024-03-19


 (7)
 

  -- or --


Summary of all available data for this site
Instantaneous-data availability statement


Discharge, cubic feet per second

Most recent instantaneous value: 2.81 03-19-2024   06:10 EDT
Graph of

Add up to 2 more sites and replot for "Discharge, cubic feet per second"

?


Create presentation-quality / stand-alone graph.   Subscribe to WaterAlert      

See this graph on the Monitoring Location Pages


Daily discharge, cubic feet per second -- statistics for Mar 19 based on 25 water years of record more
Min
(2017)
25th
percen-
tile
Median Most Recent
Instantaneous
Value Mar 19
Mean 75th
percen-
tile
Max
(2021)
1.48 2 2.8 2.81 4.3 5.1 14.6


Gage height, feet

Most recent instantaneous value: 1.31 03-19-2024   06:15 EDT
Graph of

Add up to 2 more sites and replot for "Gage height, feet"

?


Create presentation-quality / stand-alone graph.   Subscribe to WaterAlert      

See this graph on the Monitoring Location Pages


Stream water level elevation above NAVD 1988, in feet

Most recent instantaneous value: 673.31 03-19-2024   06:10 EDT
Graph of

Add up to 2 more sites and replot for "Stream water level elevation above NAVD 1988, in feet"

?


Create presentation-quality / stand-alone graph.   Subscribe to WaterAlert      

See this graph on the Monitoring Location Pages