USGS 02326550 AUCILLA RIVER NR MOUTH NEAR NUTALL RISE, FL

PROVISIONAL DATA SUBJECT TO REVISION

Click to hidestation-specific text

This gage is monitored in cooperation with the Suwannee River Water Management District.
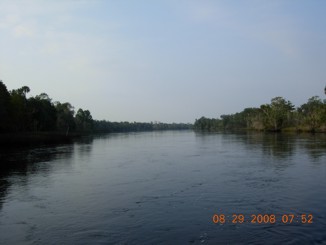
Link to the Suwannee River Water Management District


August 29, 2008.

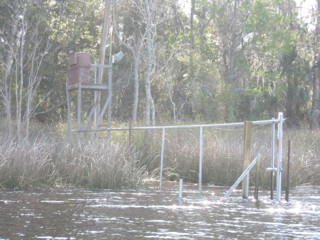
Gage structure. March 20, 2009.
Available Parameters Available Period
  
2021-05-11  2024-03-19
2021-05-11  2024-03-19
2007-10-01  2024-03-19
2007-10-01  2024-03-19
2021-05-11  2024-03-19
2021-05-11  2024-03-19
2014-10-01  2024-03-19
2021-05-15  2024-03-17
2021-11-18  2024-03-19


 (7)
 

  -- or --


Summary of all available data for this site
Instantaneous-data availability statement


Temperature, water, degrees Celsius, Bottom, [Bottom]

Most recent instantaneous value: 19.8 03-19-2024   03:15 EDT
Graph of  Temperature, water, degrees Celsius, [Bottom]

Add up to 2 more sites and replot for "Temperature, water, degrees Celsius, Bottom, [Bottom]"

?


Create presentation-quality / stand-alone graph.   Subscribe to WaterAlert      

See this graph on the Monitoring Location Pages


Temperature, water, degrees Celsius, Top, [Top]

Most recent instantaneous value: 19.5 03-19-2024   03:15 EDT
Graph of  Temperature, water, degrees Celsius, [Top]

Add up to 2 more sites and replot for "Temperature, water, degrees Celsius, Top, [Top]"

?


Create presentation-quality / stand-alone graph.   Subscribe to WaterAlert      

See this graph on the Monitoring Location Pages


Discharge, cubic feet per second

Most recent instantaneous value: 2600 03-19-2024   03:15 EDT
Graph of  Discharge, cubic feet per second

Add up to 2 more sites and replot for "Discharge, cubic feet per second"

?


Create presentation-quality / stand-alone graph.   Subscribe to WaterAlert      

See this graph on the Monitoring Location Pages


Daily discharge, cubic feet per second -- statistics for Mar 19 based on 10 water years of record more
Min
(2007)
25th
percen-
tile
Median Mean 75th
percen-
tile
Most Recent
Instantaneous
Value Mar 19
Max
(2003)
166 625 840 1290 2030 2600 3500


Gage height, feet

Most recent instantaneous value: 3.09 03-19-2024   03:15 EDT
Graph of  Gage height, feet

Add up to 2 more sites and replot for "Gage height, feet"

?


Create presentation-quality / stand-alone graph.   Subscribe to WaterAlert      

See this graph on the Monitoring Location Pages


Specific conductance, water, unfiltered, microsiemens per centimeter at 25 degrees Celsius, Bottom, [Bottom]

Most recent instantaneous value: 250 03-19-2024   03:15 EDT
Graph of  Specific conductance, water, unfiltered, microsiemens per centimeter at 25 degrees Celsius, [Bottom]

Add up to 2 more sites and replot for "Specific conductance, water, unfiltered, microsiemens per centimeter at 25 degrees Celsius, Bottom, [Bottom]"

?


Create presentation-quality / stand-alone graph.   Subscribe to WaterAlert      

See this graph on the Monitoring Location Pages


Specific conductance, water, unfiltered, microsiemens per centimeter at 25 degrees Celsius, Top, [Top]

Most recent instantaneous value: 255 03-19-2024   03:15 EDT
Graph of  Specific conductance, water, unfiltered, microsiemens per centimeter at 25 degrees Celsius, [Top]

Add up to 2 more sites and replot for "Specific conductance, water, unfiltered, microsiemens per centimeter at 25 degrees Celsius, Top, [Top]"

?


Create presentation-quality / stand-alone graph.   Subscribe to WaterAlert      

See this graph on the Monitoring Location Pages


Stream water level elevation above NAVD 1988, in feet

Most recent instantaneous value: -2.21 03-19-2024   03:15 EDT
Graph of  Stream water level elevation above NAVD 1988, in feet

Add up to 2 more sites and replot for "Stream water level elevation above NAVD 1988, in feet"

?


Create presentation-quality / stand-alone graph.   Subscribe to WaterAlert      

See this graph on the Monitoring Location Pages


Discharge, tidally filtered, cubic feet per second

Most recent instantaneous value: 1770 03-17-2024   16:00 EDT
Graph of  Discharge, tidally filtered, cubic feet per second

Add up to 2 more sites and replot for "Discharge, tidally filtered, cubic feet per second"

?


Create presentation-quality / stand-alone graph.   Subscribe to WaterAlert      

See this graph on the Monitoring Location Pages


Tidal elevation, NOS-averaged, NAVD88, feet

Most recent instantaneous value: -2.23 03-19-2024   03:24 EDT
Graph of  Tidal elevation, NOS-averaged, NAVD88, feet

Add up to 2 more sites and replot for "Tidal elevation, NOS-averaged, NAVD88, feet"

?


Create presentation-quality / stand-alone graph.   Subscribe to WaterAlert      

See this graph on the Monitoring Location Pages