PROVISIONAL DATA SUBJECT TO REVISION
Click to hidestation-specific text
This gage is monitored in cooperation with:
|
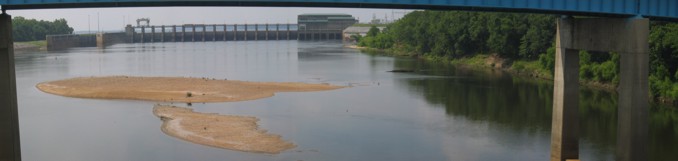
Upstream view. |
|
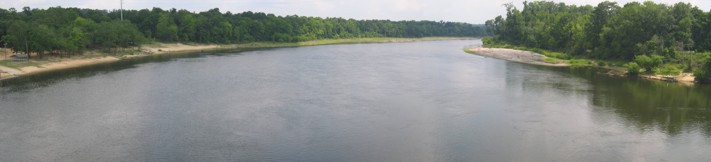
Downstream view. |
Instantaneous-data availability statement


