PROVISIONAL DATA SUBJECT TO REVISION
Click to hidestation-specific text
This gage is monitored in cooperation with:
Florida Department of Environmental Protection. |
National Groundwater and Streamflow Information Program. |
- NWS Flood Forecast for location
- NWS Southeast River Forecast Center
|
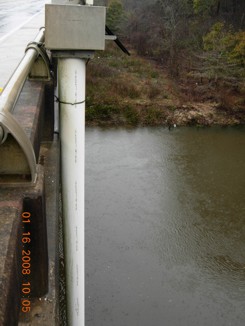
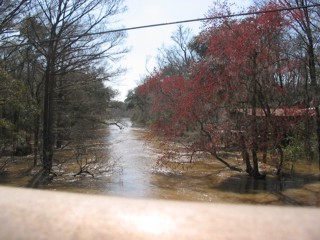
Gage structure-January 16, 2008. February 25, 2008. |
Instantaneous-data availability statement

