PROVISIONAL DATA SUBJECT TO REVISION
Click to hidestation-specific text
|
This gage is monitored in cooperation with the Florida Department of Environmental Protection and in collaboration with Nestle Waters North America, Inc.
|
- NWS Flood Forecast for location
- NWS Southeast River Forecast Center
|
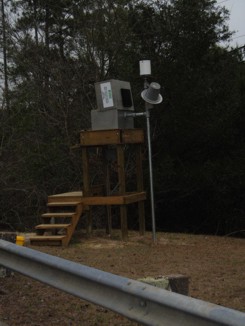
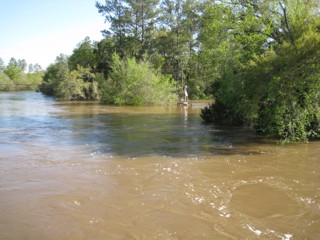
Gage structure-January 04, 2007. High water from April 3, 2009. |
Instantaneous-data availability statement


