PROVISIONAL DATA SUBJECT TO REVISION
Click to hidestation-specific text
 STATION.--03042000 BLACKLICK CREEK AT JOSEPHINE,
PA
STATION.--03042000 BLACKLICK CREEK AT JOSEPHINE,
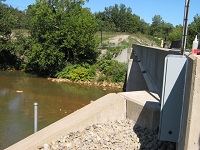
PALOCATION.--Lat 40`28'37", long 79`11'13", Indiana County, Hydrologic Unit 05010007, on left bank on downstream side of Josephine Bridge on Old Indiana Road, 0.5 mi upstream from Two Lick Creek, and 5 mi northeast of Blairsville.
DRAINAGE AREA.--193 square miles.
PERIOD OF RECORD.--January 1952 to current year.
GAGE.--Water-stage recorder and crest-stage gage. Datum of gage is 964.5 ft above North American Vertical Datum of 1988. Prior to Aug. 25, 1953, non-recording gage at same site and datum. Prior to Oct 2009 station located 0.4 miles upstream at datum 11.32 feet higher at 40`28'24" 79`11'01". Prior to December 14, 2023, the datum of gage was erroneously reported as 954.46 ft above North American Vertical Datum of 1988. The datum of gage prior to October 1, 2009 was reported as 21.36 ft higher. Satellite telemetry at station.
COOPERATION.--Station established and maintained by the U.S. Geological Survey. Funding for the operation of this station is provided by the U.S. Army Corps of Engineers, Pittsburgh District, the Pennsylvania Department of Environmental Protection and the U.S. Geological Survey.
REMARKS.--Some regulation at low flow by mine pumpage above station.
GAGE HEIGHTS OF IMPORTANCE.-
Supplied by NWS: Action stage-12.4 ft; Flood stage-16.5 ft.
Summary of all available data for this site
Instantaneous-data availability statement
