PROVISIONAL DATA SUBJECT TO REVISION
Click to hidestation-specific text
Funding for this site is provided by:
 Site Information
LOCATION.--Lat 43°06'02", long
77°52'56" referenced to North American Datum of 1983,
Monroe County, NY, Hydrologic Unit 04130003, on right bank at
east end of Carrol Street in Churchville, 100 ft downstream
from mainline tracks of Penn Central Transportation Co., and
0.3 mi downstream from Black Creek Dam.
DRAINAGE AREA.--130 mi².
PERIOD OF RECORD.--October 1945 to current year.
REVISIONS HISTORY.--WDR NY-82-3: Drainage area. WDR NY-00-3: 1998 (M), 1999 (M).
GAGE.--Water-stage recorder. Datum of gage is 551.88 ft above NGVD of 1929 (New York State Department of Transportation bench mark) and 551.30 ft above NAVD of 1988.
COOPERATION.--Water-quality samples were collected by the Monroe County Department of Environmental Services and analyzed by the Monroe County Environmental Laboratory at Rochester, NY. Prior to 2003, water-quality samples were collected by the Monroe County Environmental Health Laboratory at Rochester, N.Y.
REMARKS.--Prior to May 1952, small diversion by Penn Central Transportation Co. and slight regulation by pumping operations upstream from station.
Water Years 2014-24: Records good except those for estimated daily discharges, which are poor.
EXTREMES FOR PERIOD OF RECORD.--Maximum discharge, 4,880 ft³/s, Mar. 31, 1960, gage height, 9.44 ft; minimum discharge, 0.16 ft³/s, July 17, 2016; minimum gage height, 0.93 ft, Aug. 5, 6, 7, Sept. 15, 1959.
PERIOD OF DAILY RECORD1.--WATER TEMPERATURE: October 1961 to September 1962.
1 Water-Quality Records
 WaterAlert – get an
email or text (SMS) alert based on your chosen threshold.
WaterAlert – get an
email or text (SMS) alert based on your chosen threshold.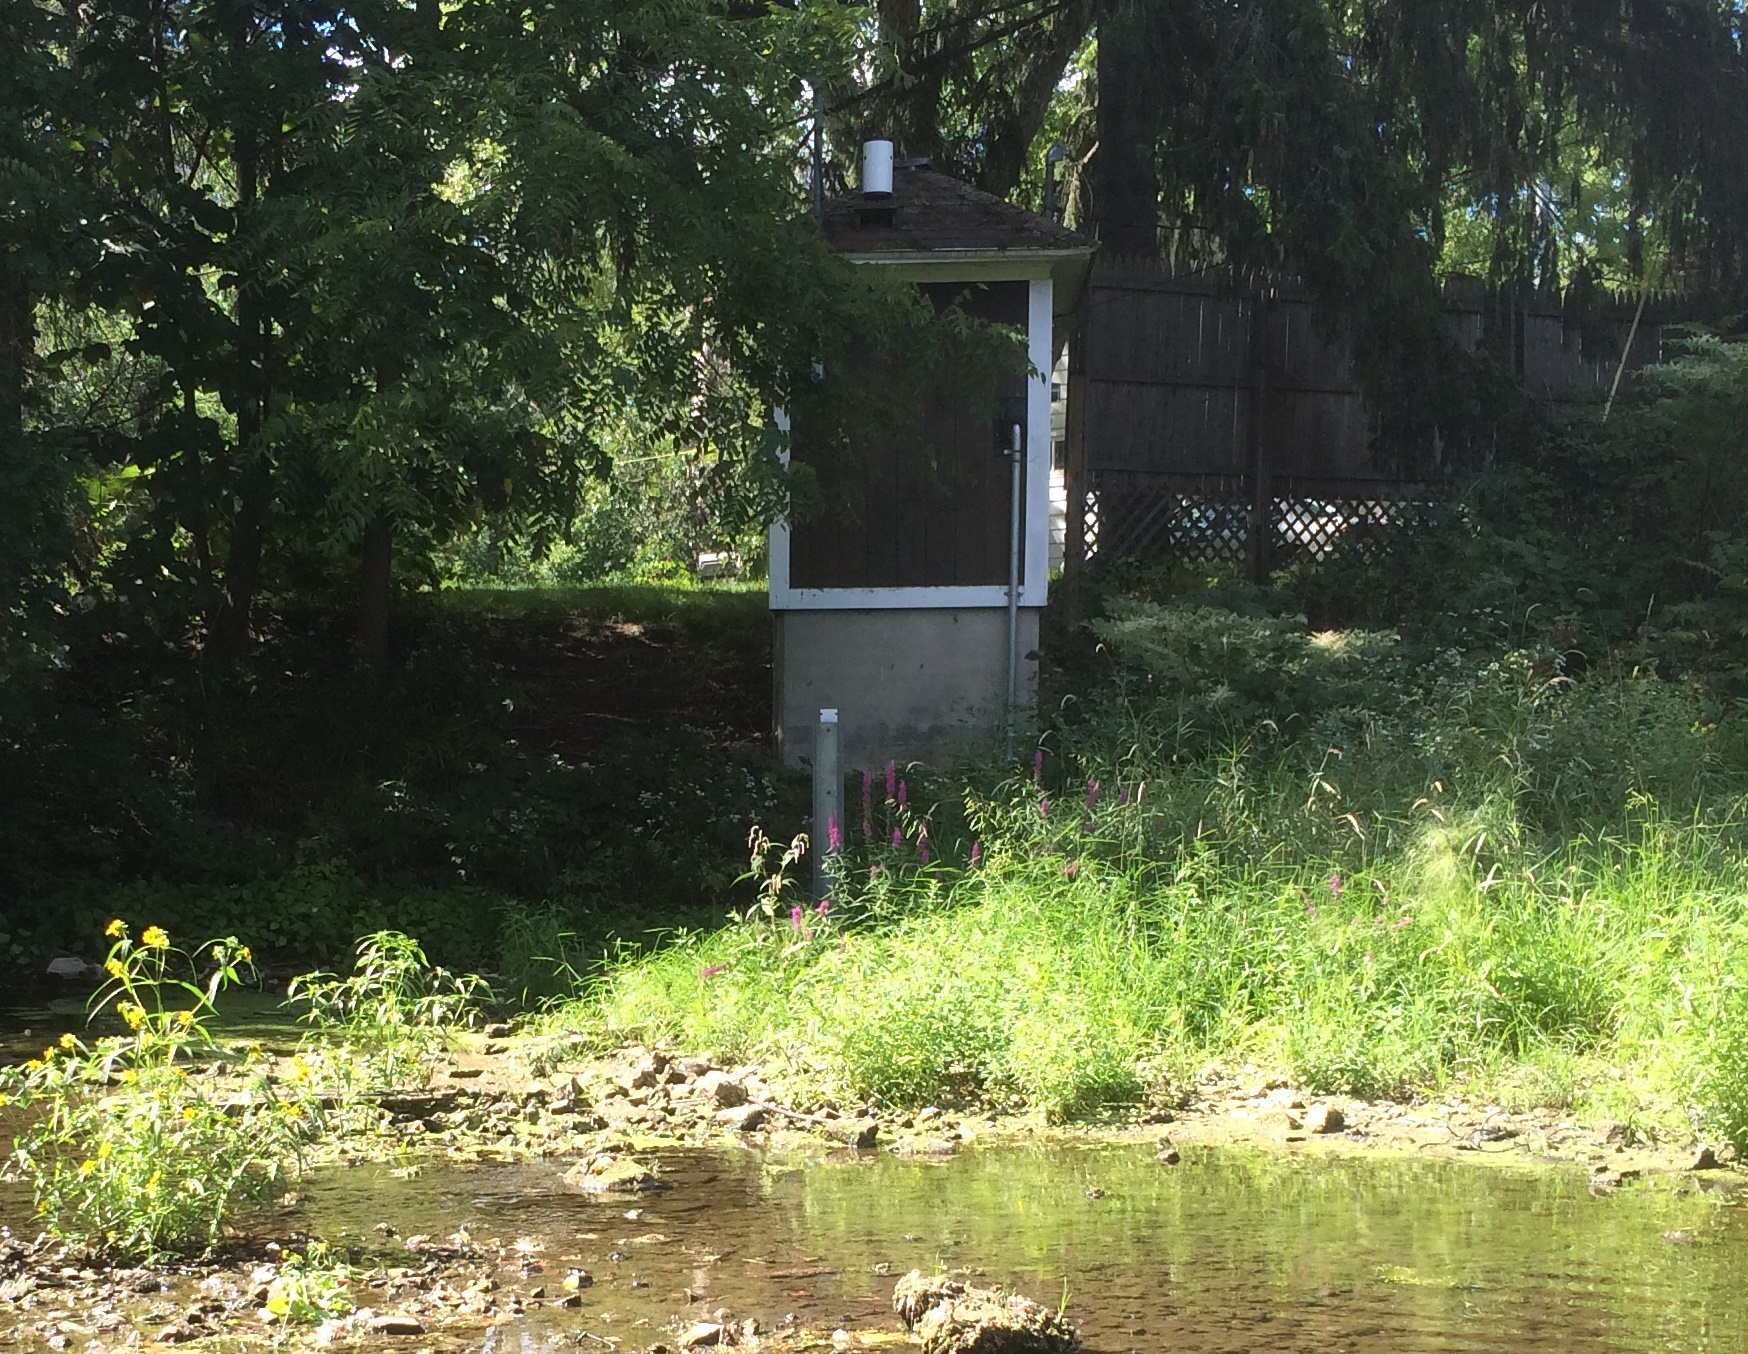 Station image
Summary of all available data for this site
Instantaneous-data availability statement

