PROVISIONAL DATA SUBJECT TO REVISION
Click to hidestation-specific text
 Site Information
LOCATION.--Lat 42°59'00", long
76°09'03" referenced to North American Datum of 1983,
Onondaga County, NY, Hydrologic Unit 04140201, on left bank 550
ft upstream from bridge on Dorwin Avenue, at Syracuse, and 4.0
mi downstream from Onondaga Reservoir.
DRAINAGE AREA.--88.5 mi².
PERIOD OF RECORD.--May 1951 to September 2020, October 2021 to current year.
REVISIONS HISTORY.--WSP 2112: Drainage area.
GAGE.--Water-stage recorder, crest-stage gage, and concrete control. Datum of gage is 414.19 ft above NGVD of 1929 and 413.61 ft above NAVD of 1988.
REMARKS.--High flows regulated by Onondaga Reservoir.
Water Years 2014-15: Records good except those for estimated daily discharges, which are fair.
Water Years 2016-20, 2023-24: Records good except those for estimated daily discharges, which are poor.
Water Year 2022: Records fair except those for estimated daily discharges, which are poor.
EXTREMES FOR PERIOD OF RECORD.--Maximum discharge, 3,260 ft³/sec, July 3, 1974, gage height, 6.48 ft; minimum daily discharge, 5.5 ft³/s, Aug. 17, 1965; minimum gage height, 1.15 ft, Sept. 16, 1959.
 WaterAlert – get an
email or text (SMS) alert based on your chosen threshold.
WaterAlert – get an
email or text (SMS) alert based on your chosen threshold.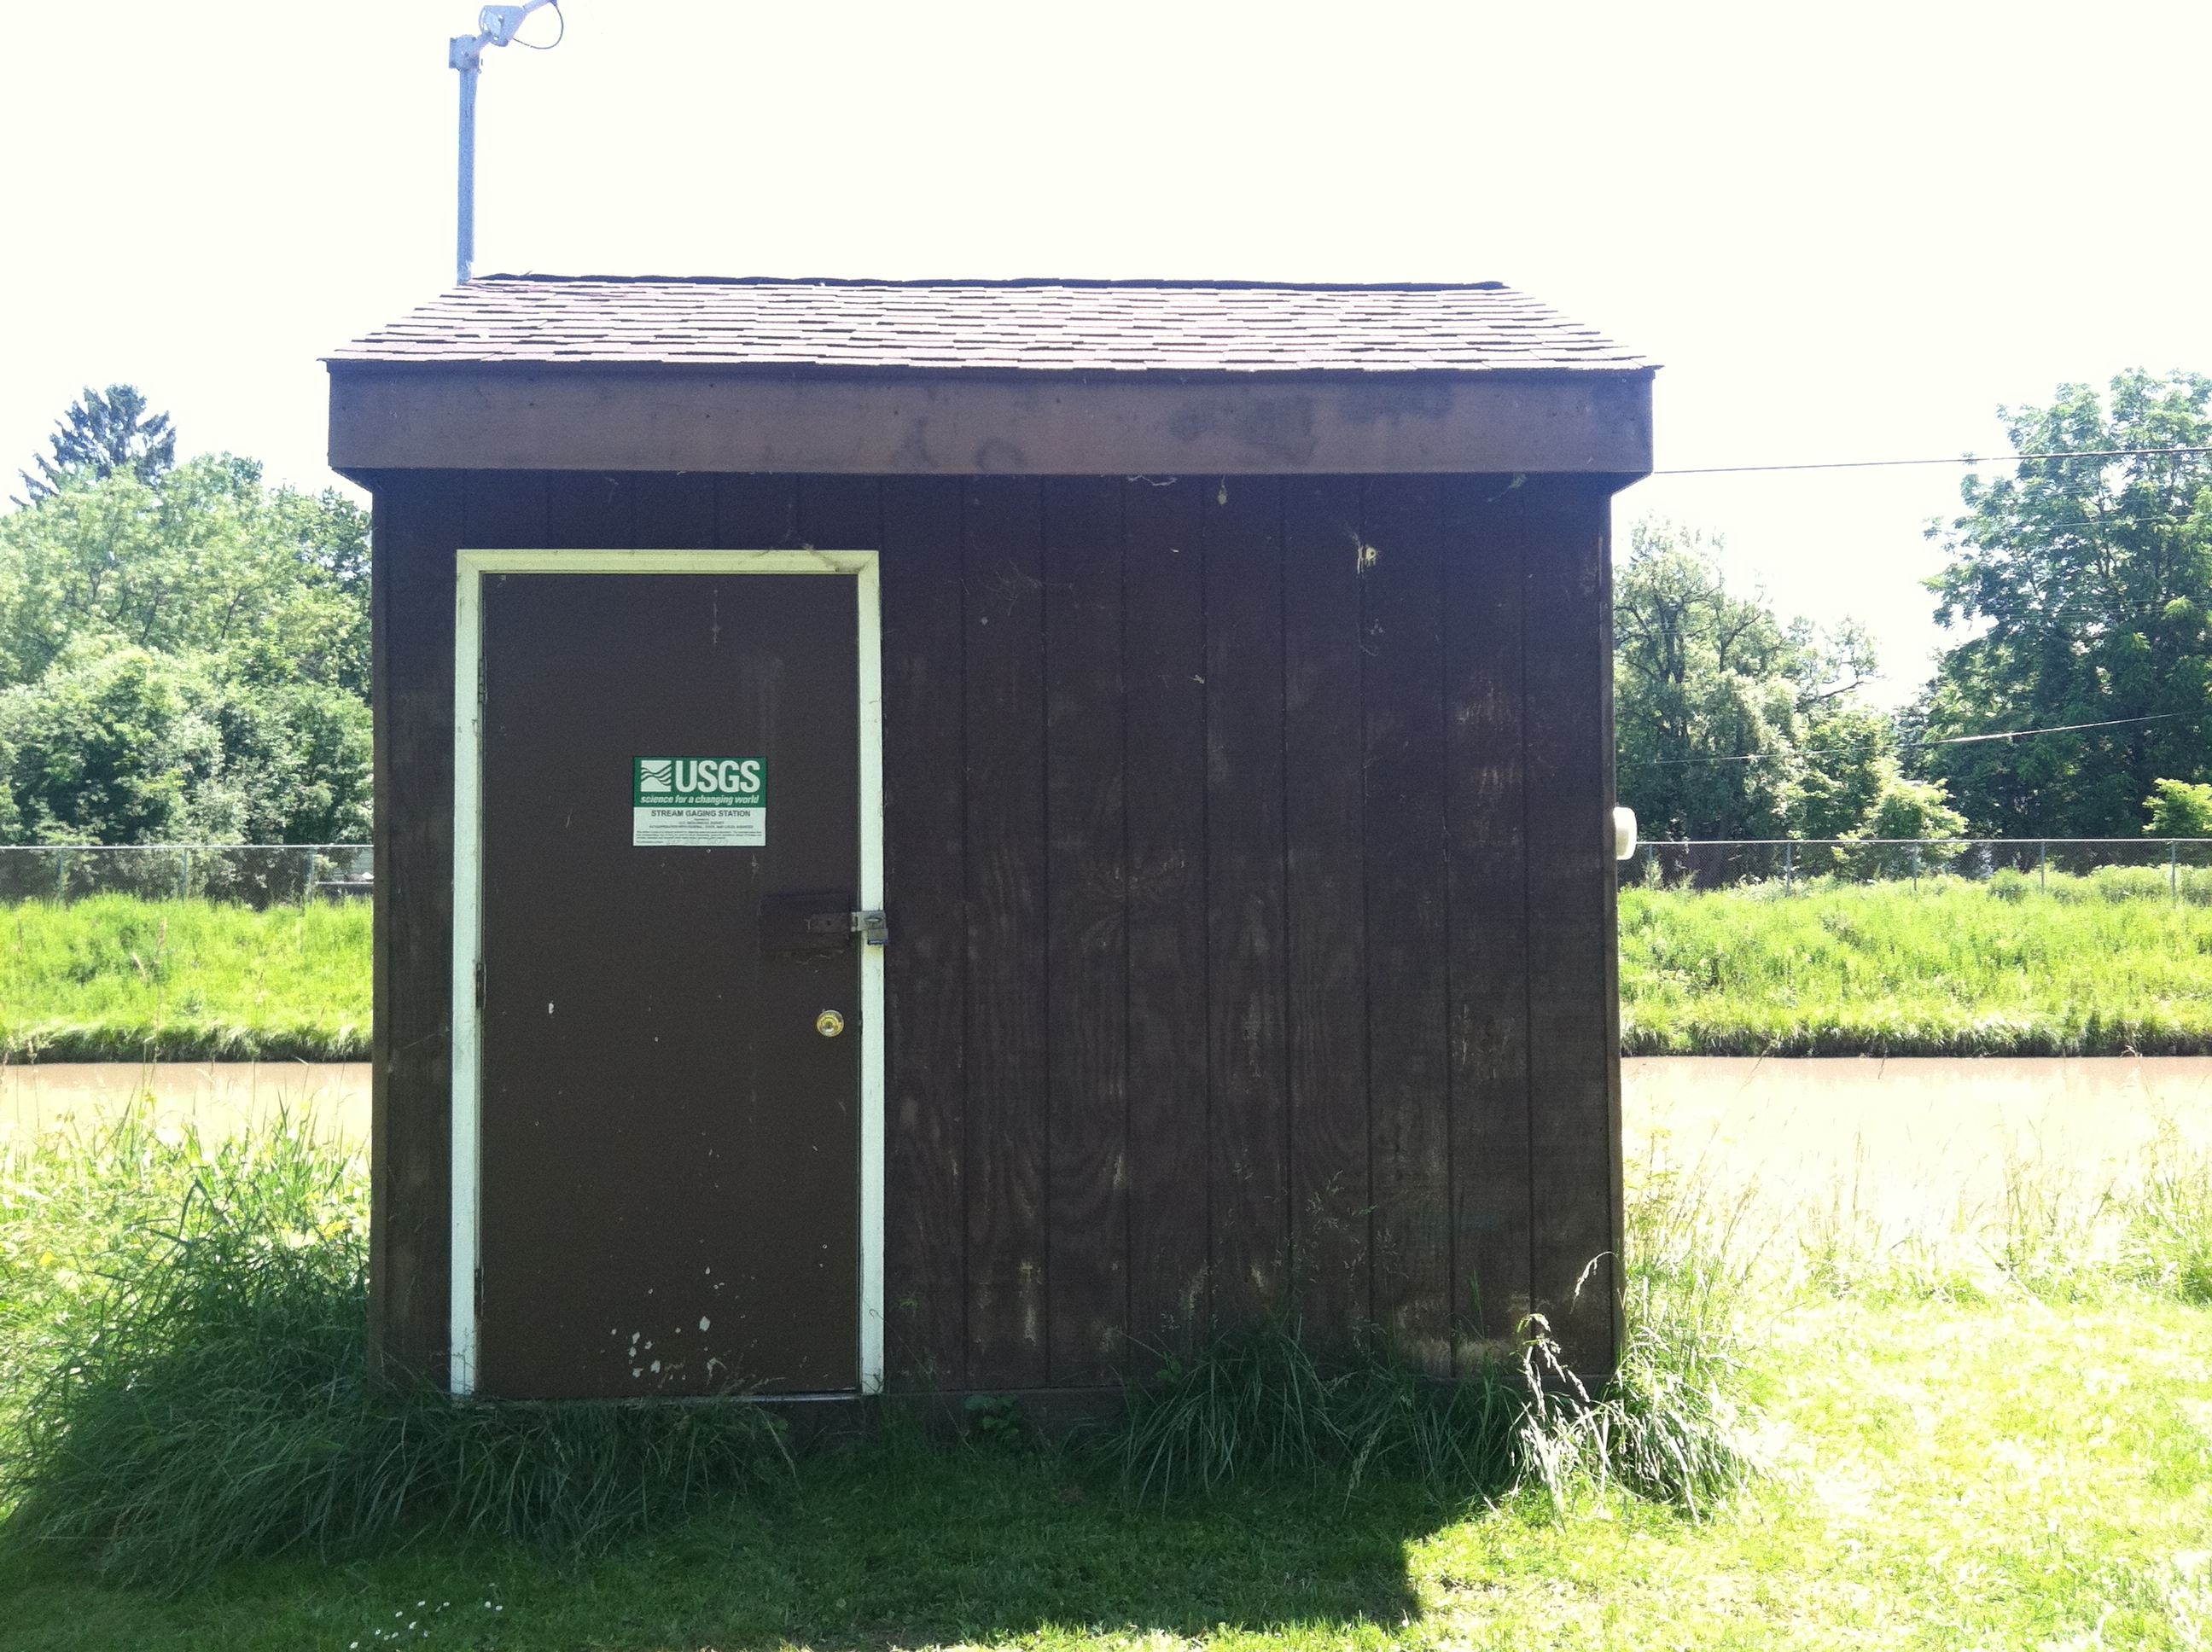 Station image
Summary of all available data for this site
Instantaneous-data availability statement

