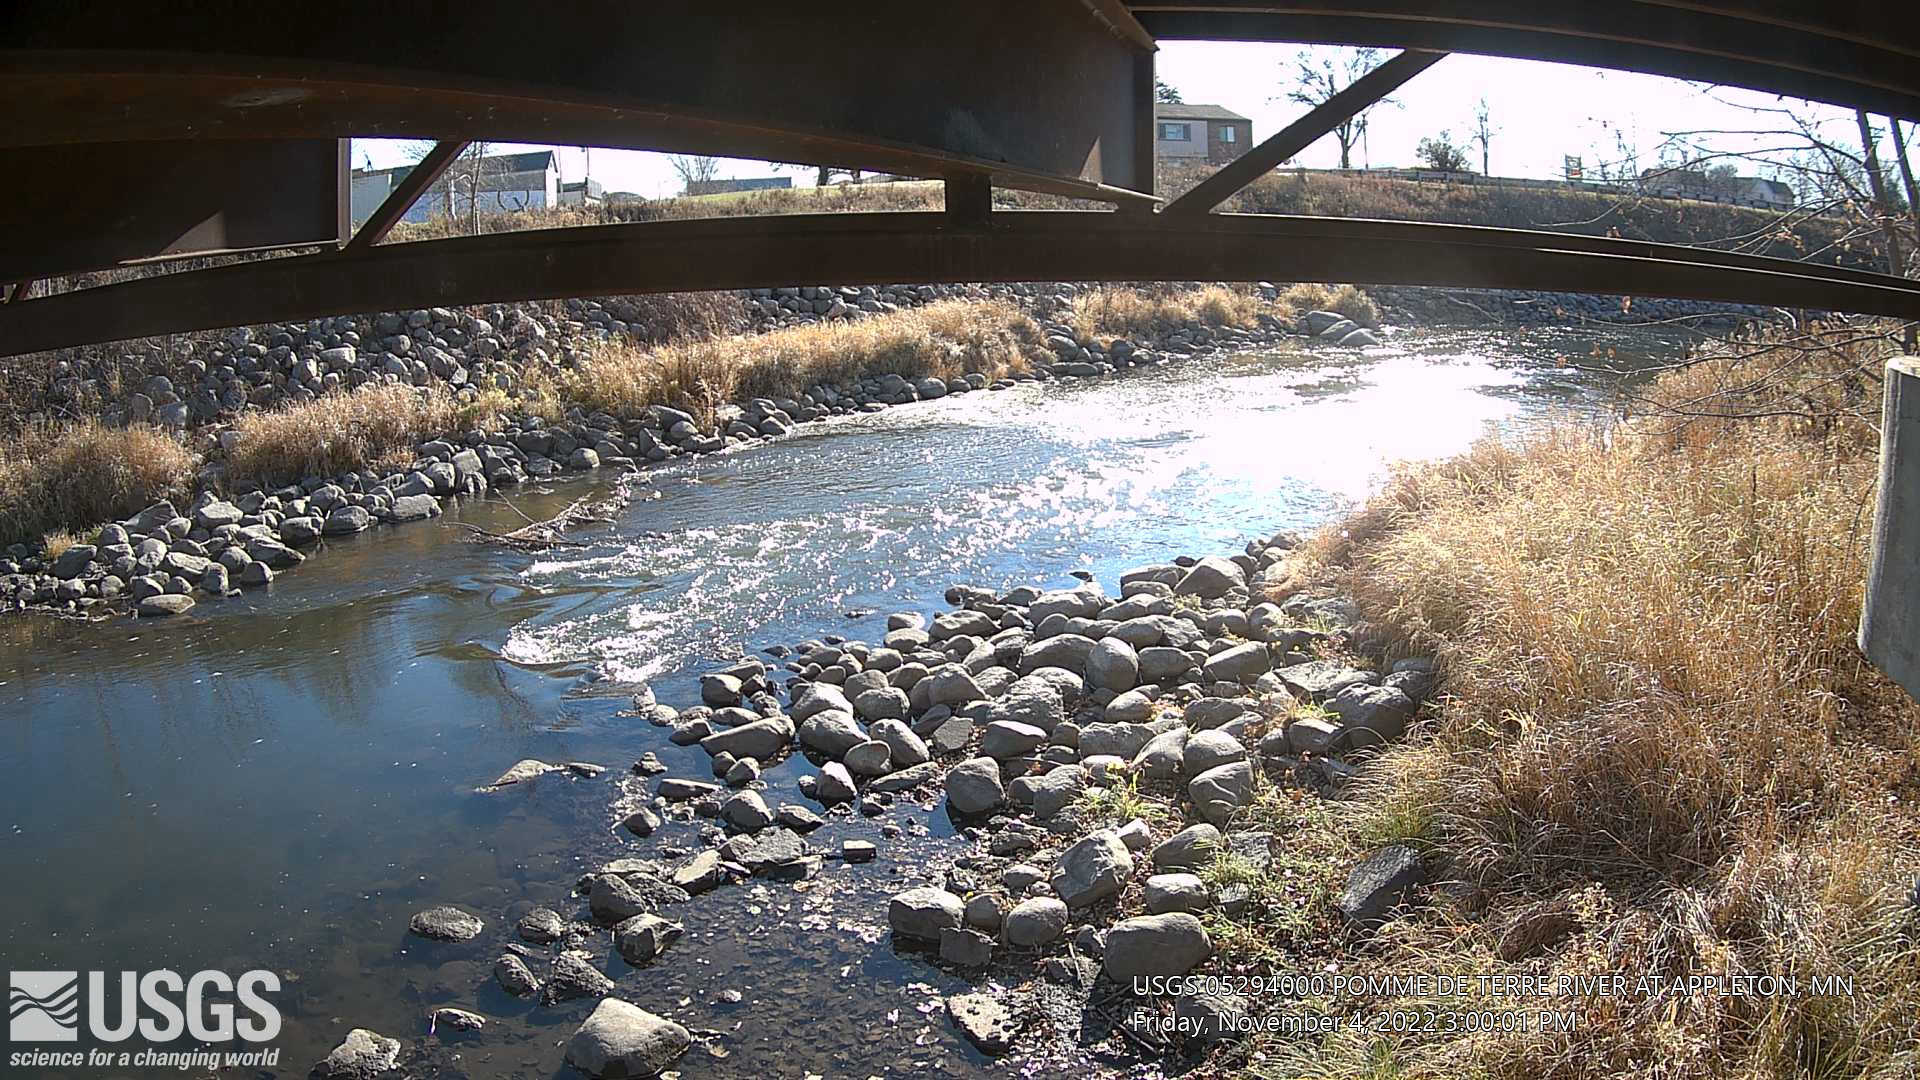
USGS 05294000 POMME DE TERRE RIVER AT APPLETON, MN

PROVISIONAL DATA SUBJECT TO REVISION

Click to hidestation-specific text
Operated in cooperation with the

Minnesota
Department of Natural Resources Logo Minnesota Department of Natural Resources - Ecological and Water Resources Division

Links to additional information:

  • USGS WaterWatch's Site Dashboard provides seasonal and other context-oriented information about current and historical streamflow.
  • Recent Webcam Images:

    Webcam images help USGS staff monitor river conditions, such as when backwater from ice affects discharge. Click on the static or time-lapse images below to download or view larger versions from the USGS HIVIS web page .

  • Most recent photo of river
This station managed by the Mounds View Field Office.

Available Parameters Available Period
  
1991-10-01  2026-07-29
2007-10-01  2026-07-29
2023-07-28  2026-07-29


 (7)
 

  -- or --


Summary of all available data for this site
Instantaneous-data availability statement


Discharge, cubic feet per second

Most recent instantaneous value: 108 07-29-2026   18:00 CDT
Graph of

Add up to 2 more sites and replot for "Discharge, cubic feet per second"

?


Create presentation-quality / stand-alone graph.   Subscribe to WaterAlert      

See this graph on the Monitoring Location Pages


Daily discharge, cubic feet per second -- statistics for Jul 29 based on 92 water years of record more
Min
(1988)
25th
percen-
tile
Median Most Recent
Instantaneous
Value Jul 29
Mean 75th
percen-
tile
Max
(1993)
0.00 42 90 108 178 182 2200


Gage height, feet

Most recent instantaneous value: 4.58 07-29-2026   18:00 CDT
Graph of

Add up to 2 more sites and replot for "Gage height, feet"

?


Create presentation-quality / stand-alone graph.   Subscribe to WaterAlert      

See this graph on the Monitoring Location Pages


Stream water level elevation above NAVD 1988, in feet

Most recent instantaneous value: 983.21 07-29-2026   18:00 CDT
Graph of  Stream water level elevation above NAVD 1988, in feet

Add up to 2 more sites and replot for "Stream water level elevation above NAVD 1988, in feet"

?


Create presentation-quality / stand-alone graph.   Subscribe to WaterAlert      

See this graph on the Monitoring Location Pages