LOCATION.--Lat 41°00'39", long 92°24'40"
referenced to North American Datum of 1927, in SE 1/4 SE 1/4 NE 1/4
sec.25, T.72 N., R.14 W., Wapello County, IA, Hydrologic Unit
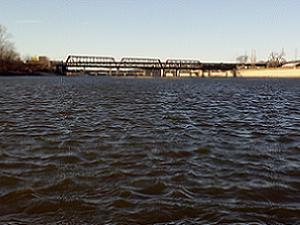
07100009, on downstream side of bridge on Chief Wapello Trail (former
Colorado and Eastern Railroad bridge) in Ottumwa, 0.5 mi downstream
from Ottumwa power plant, 6.5 mi upstream from Village Creek, 9.5 mi
downstream from South Avery Creek, and 91.9 mi upstream from mouth.
(map)
DRAINAGE AREA.--13,374 mi2.
SURFACE-WATER RECORDS
PERIOD OF RECORD.--Discharge records from March 1917 to current
year. October 1930 to March 1935, published as "at Eldon".
Prior to April 1935, monthly mean discharge for some periods
published in WSP 1308.
REVISED RECORDS.--WSP 525: 1917-20. WSP 1308: 1917-23 (M), 1925-27
(M), 1931. WSP 1438: Drainage area.
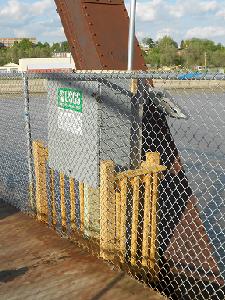
GAGE.--Water-stage recorder. Datum of gage is 622.00 ft above
National Geodetic Vertical Datum of 1929. Prior to October 1, 1930,
non-recording gage 1,700 ft upstream at Market Street bridge at datum
0.83 ft higher; October 1, 1930, to March 31, 1935, non-recording
gage 15 mi downstream in Eldon at different datum; April 1, 1935, to
October 25, 1963, water-stage recorder 1,100 ft downstream at Vine
Street bridge at datum 0.77 ft higher.
REMARKS.--Prior to December 12, 1958, and since November 30, 1960,
minor diurnal fluctuations during periods of low and medium flows due
to operations of power plant located 0.5 mi upstream. Flow regulated
by Lake Red Rock (station 05488100), 48.2 mi upstream, since March
12, 1969.
WATER-QUALITY RECORDS
PERIOD OF RECORD.--Water year 2008.

 Site Information