LOCATION.--Lat 40°03'13.1", long 95°25'20.7"
referenced to North American Datum of 1983, in NW 1/4 NW 1/4 sec.17,
T.1 N., R.18 E., Richardson County, NE, Hydrologic Unit 10240005, on
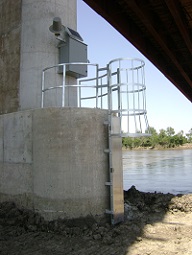
right bank on downstream side of bridge on U.S. Highway 159 in Rulo,
3.2 mi upstream from Big Nemaha River, and 498.0 mi upstream from
mouth. (map)
DRAINAGE AREA.--414,900 mi2.
SURFACE-WATER RECORDS
PERIOD OF RECORD.--Discharge records from October 1949 to current
year. Stage-only records collected at site 80 ft upstream from
January 1886 to December 1899 in reports of Missouri River
Commission, and from September 1929 to September 1950 in files of
Kansas City office of the U.S. Army Corps of Engineers.
GAGE.--Water-stage recorder. Datum of gage is
838.16 ft above North American Vertical Datum of 1988. Prior to
August 1, 2016, datum of gage was 837.23 ft above National Geodetic
Vertical Datum of 1929. October 1, 1949, to September 12,
1950, non-recording gage at site 80 ft upstream at same datum;
September 13, 1950, to April 19, 1983, water-stage recorder on
downstream end of middle pier at same datum.
REMARKS.--Flow regulated by upstream main-stem reservoirs. Fort
Randall Dam was completed in July 1952, with storage beginning in
December 1952. Gavins Point Dam was completed in July 1955, with
storage beginning in December 1955.
WATER-QUALITY RECORDS
PERIOD OF RECORD.--Water year 2008.
PERIOD OF DAILY RECORD.--
WATER TEMPERATURE: June 2012 to current year.

 Site Information